Open Access
Fig. 8.
Download original image
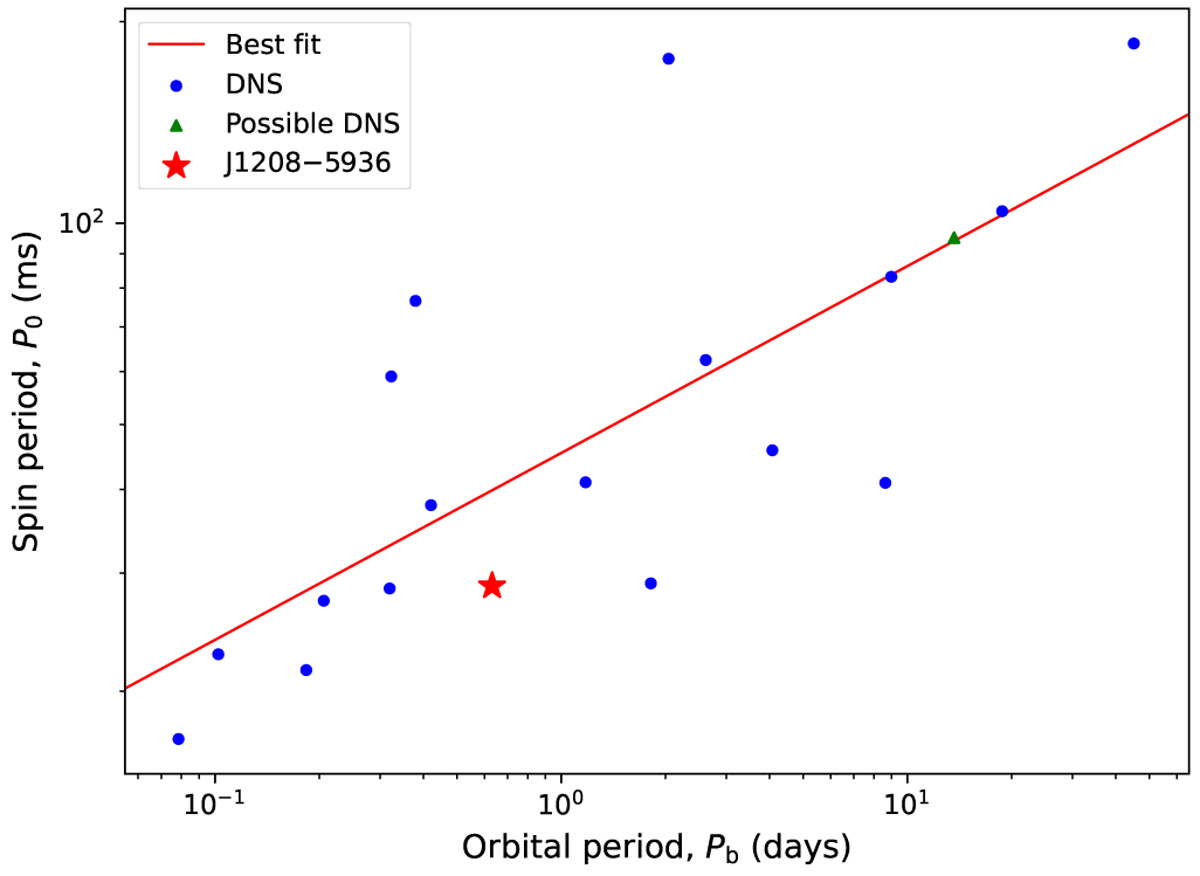
P0 − Pb diagram of the known recycled pulsars in DNS systems population. The lines represent linear regression fits to the data points in the log space, added to aid in the visualisation of the trend.
Current usage metrics show cumulative count of Article Views (full-text article views including HTML views, PDF and ePub downloads, according to the available data) and Abstracts Views on Vision4Press platform.
Data correspond to usage on the plateform after 2015. The current usage metrics is available 48-96 hours after online publication and is updated daily on week days.
Initial download of the metrics may take a while.