Open Access
Fig. 7.
Download original image
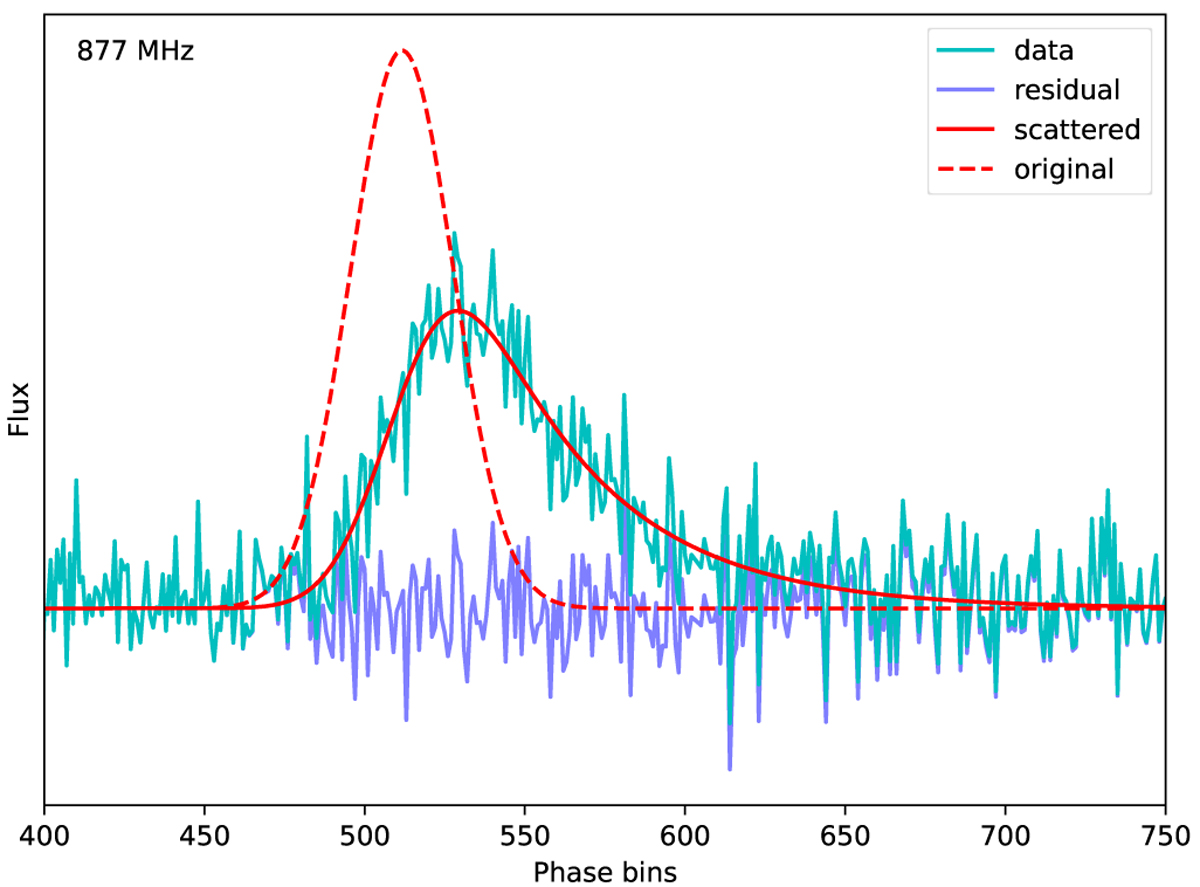
Fit of Eq. (10) (red line) at the bottom-most sub-band of 877 MHz (cyan line). The fit is effective at getting the general shape of the pulse profile, with little structure left in the residuals (dark blue line). Table 3 lists the best scattering timescales and Gaussian widths for all fitted frequencies.
Current usage metrics show cumulative count of Article Views (full-text article views including HTML views, PDF and ePub downloads, according to the available data) and Abstracts Views on Vision4Press platform.
Data correspond to usage on the plateform after 2015. The current usage metrics is available 48-96 hours after online publication and is updated daily on week days.
Initial download of the metrics may take a while.