Fig. 2.
Download original image
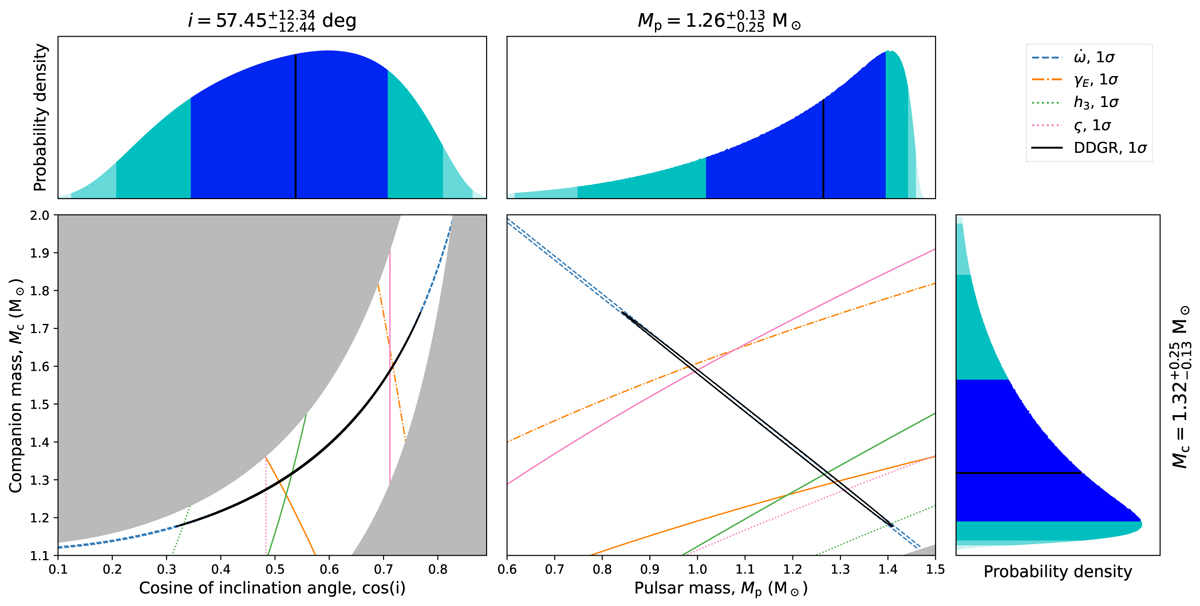
Corner plot showing the constraints on the inclination angle and component masses from PK parameters and the χ2 mapping of DDGR solutions. Central plots: mass–mass diagrams portraying the DDH PK parameters constraints, with each color corresponding to a different parameter as indicated in the legend (solid lines: nominal value, dashed lines: 1σ limits), and the 1σ limits from DDGR χ2 mapping in black. The shaded grey area on the right plot represents the region excluded by the mass function (i > 90), while the shaded areas on the left plot represent the areas outside the prior for Mp (outside of 0.6 < Mp < 1.5 M⊙). The explored regions of the Mp and Mc were decided based on the limits given by the mass function and Mt (from ![]() ). Outer plots: marginalised one-dimensional probability densities for Mp, Mc and cos i from DDGR χ2 mapping, showcasing the median value (black solid line) and the 31.4%, 47.4% and 49.9% percentiles on both sides (shaded areas). The resulting mass constraints are consistent with a pair of NSs.
). Outer plots: marginalised one-dimensional probability densities for Mp, Mc and cos i from DDGR χ2 mapping, showcasing the median value (black solid line) and the 31.4%, 47.4% and 49.9% percentiles on both sides (shaded areas). The resulting mass constraints are consistent with a pair of NSs.
Current usage metrics show cumulative count of Article Views (full-text article views including HTML views, PDF and ePub downloads, according to the available data) and Abstracts Views on Vision4Press platform.
Data correspond to usage on the plateform after 2015. The current usage metrics is available 48-96 hours after online publication and is updated daily on week days.
Initial download of the metrics may take a while.