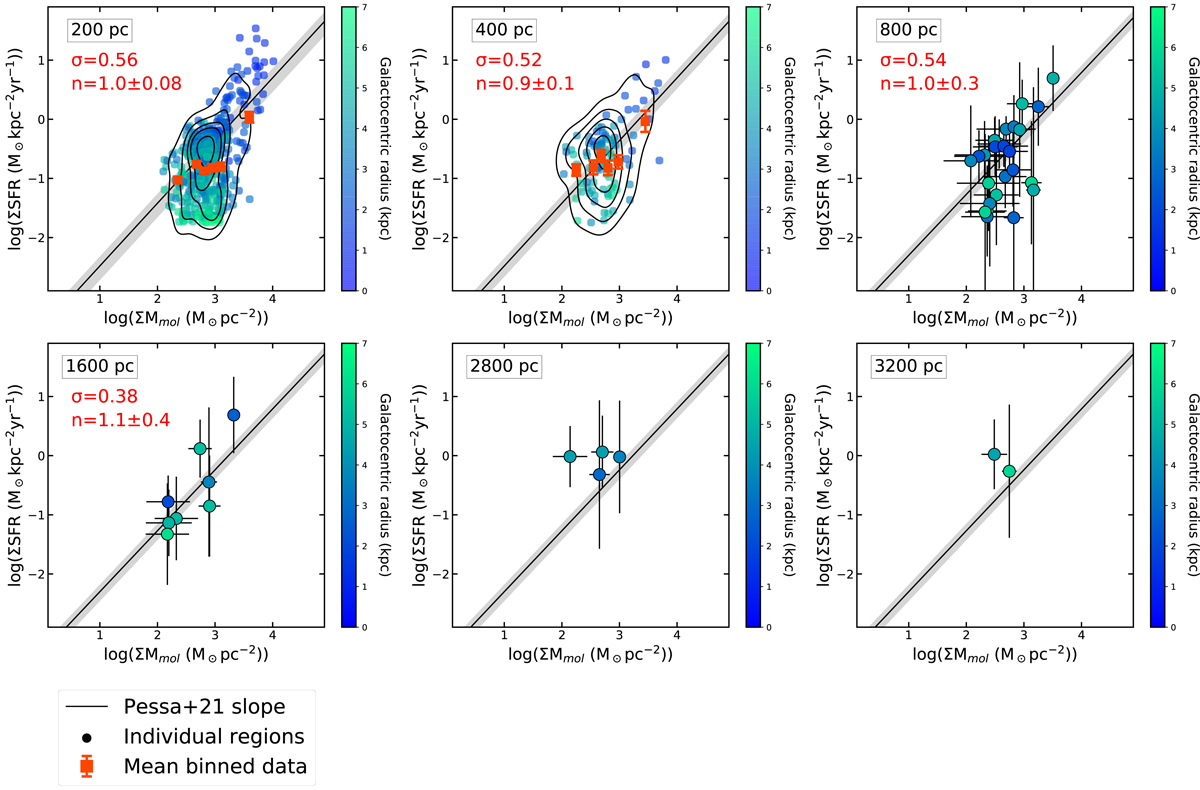
Fig. 5.
Download original image
rKS diagram of the Cosmic Snake at different spatial scales. Each panel corresponds to a given bin size in the source plane, as indicated. The contours plotted in the first two panels are kernel density estimates of the data. The five different contours correspond (from inside to outside) to 10%, 30%, 50%, 70%, and 90% iso-proportions of the density. The black line is the rKS slope obtained by Pessa et al. (2021) at the closest spatial scale to ours (n100 pc = 1.06, n500 pc = 1.06, and n1 kpc = 1.03), with the grey shaded area showing the corresponding scatter (σ100 pc = 0.41, σ500 pc = 0.33, and σ1 kpc = 0.27). The datapoints are coloured according to their galactocentric distance, as shown in the colour bars. The orange squares correspond to the ΣSFR means of datapoints within six ΣMmol bins with and equal number of datapoints. Reported in the upper left corner is the scatter (σ) of the datapoints with respect to the fits from Pessa et al. (2021), as well as the slopes (n) obtained from a linear fitting for the bin sizes between 200 pc and 1600 pc.
Current usage metrics show cumulative count of Article Views (full-text article views including HTML views, PDF and ePub downloads, according to the available data) and Abstracts Views on Vision4Press platform.
Data correspond to usage on the plateform after 2015. The current usage metrics is available 48-96 hours after online publication and is updated daily on week days.
Initial download of the metrics may take a while.