Fig. 4.
Download original image
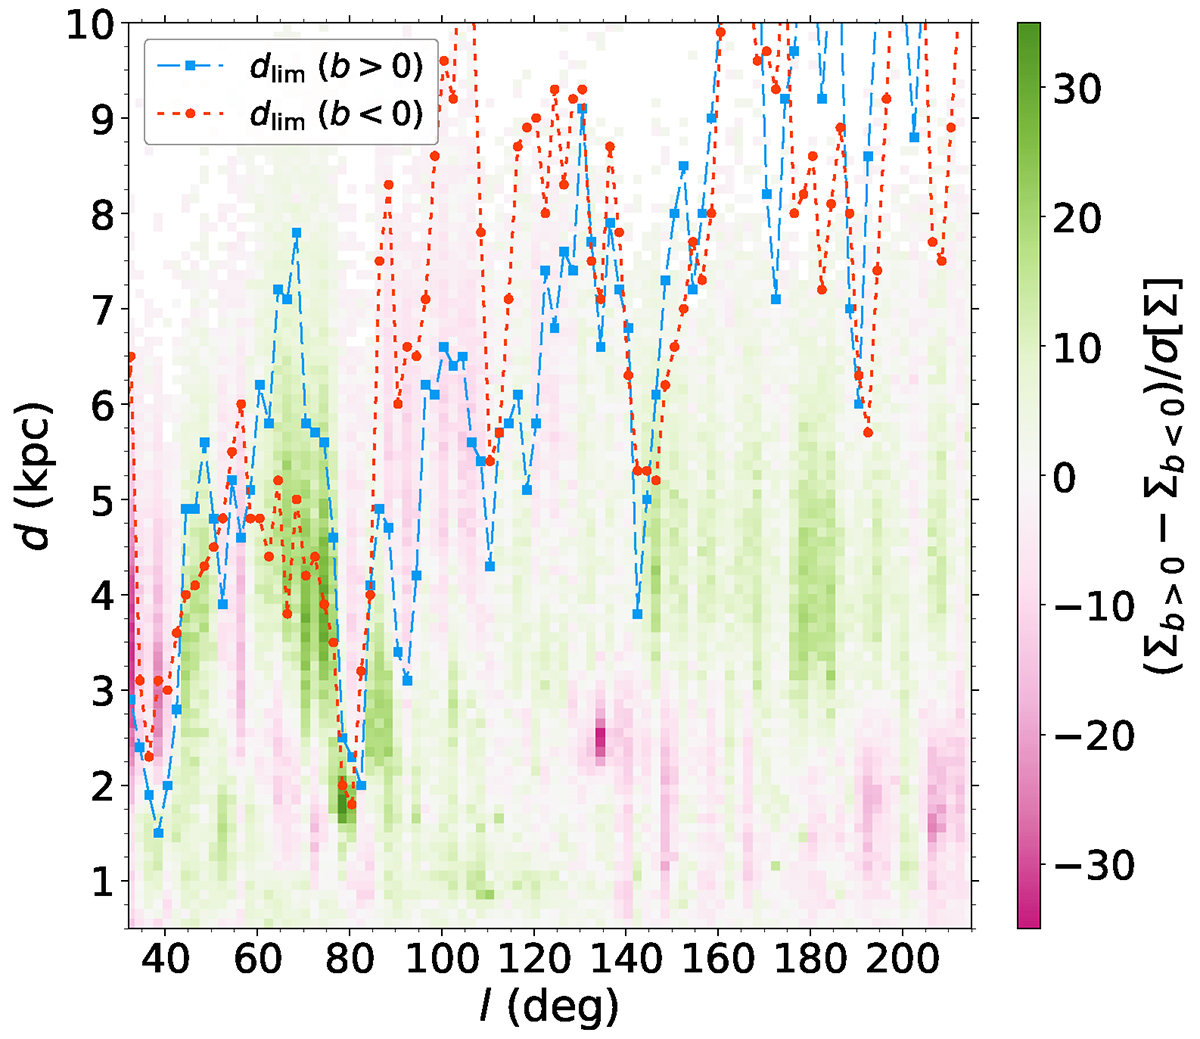
Heliocentric distance versus Galactic longitude map of the difference between the surface densities for b > 0° and b < 0° relative to the uncertainty of the density of the full pP30 sample. Positive values mean larger densities in the northern bin. Estimations of completeness limits for the b < 0° (b > 0°) subsample are shown as orange circles (blue squares) connected by a dotted (dashed) line that guides the eye.
Current usage metrics show cumulative count of Article Views (full-text article views including HTML views, PDF and ePub downloads, according to the available data) and Abstracts Views on Vision4Press platform.
Data correspond to usage on the plateform after 2015. The current usage metrics is available 48-96 hours after online publication and is updated daily on week days.
Initial download of the metrics may take a while.