Open Access
Fig. 3.
Download original image
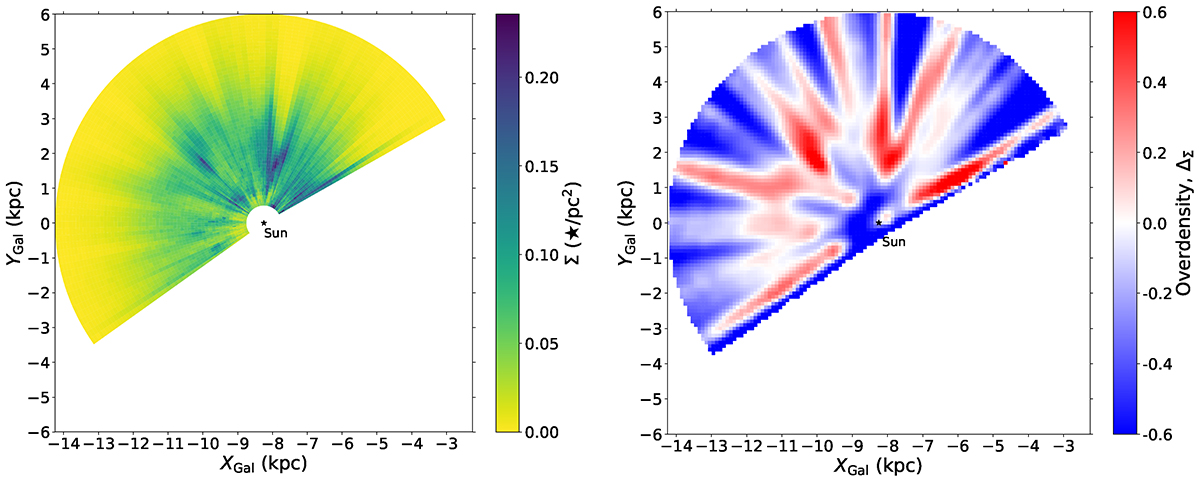
Galactocentric XY maps of the stellar surface density (left) and local overdensities (right) for the pP30 sample. The solar position is indicated with a black star at XGal = −R⊙ and the GC is at the origin, beyond the right-hand edge of each plot.
Current usage metrics show cumulative count of Article Views (full-text article views including HTML views, PDF and ePub downloads, according to the available data) and Abstracts Views on Vision4Press platform.
Data correspond to usage on the plateform after 2015. The current usage metrics is available 48-96 hours after online publication and is updated daily on week days.
Initial download of the metrics may take a while.