Open Access
Fig. D.1.
Download original image
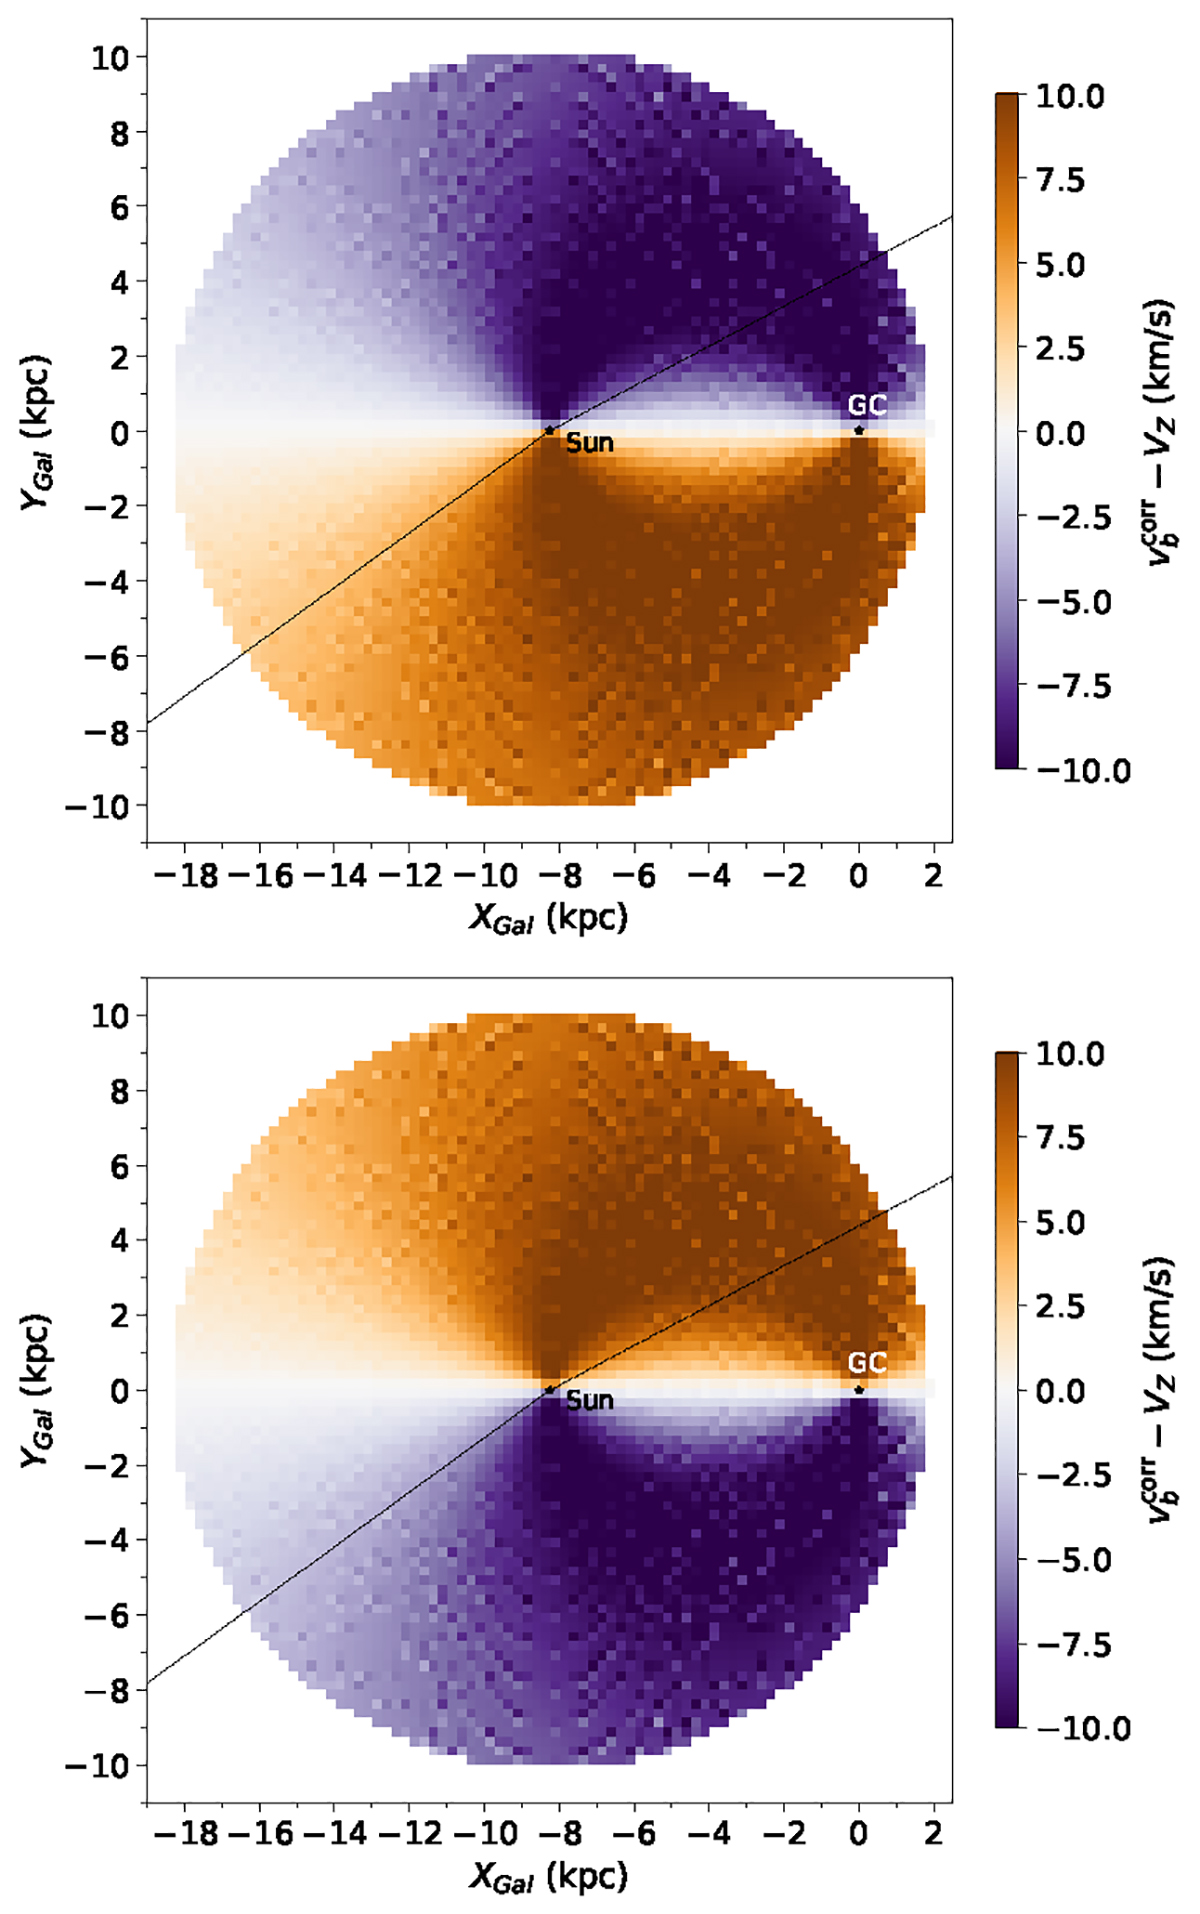
XY map of median differences between ![]() and VZ obtained with the model restricted to Z > 0 (up) and to Z < 0 (bottom). In both panels, the GC is at the origin of coordinates and the Sun is centred. Bins are squares of side 0.25 kpc. Black diagonal lines show the Galactic longitude limits of our samples.
and VZ obtained with the model restricted to Z > 0 (up) and to Z < 0 (bottom). In both panels, the GC is at the origin of coordinates and the Sun is centred. Bins are squares of side 0.25 kpc. Black diagonal lines show the Galactic longitude limits of our samples.
Current usage metrics show cumulative count of Article Views (full-text article views including HTML views, PDF and ePub downloads, according to the available data) and Abstracts Views on Vision4Press platform.
Data correspond to usage on the plateform after 2015. The current usage metrics is available 48-96 hours after online publication and is updated daily on week days.
Initial download of the metrics may take a while.