Fig. 10.
Download original image
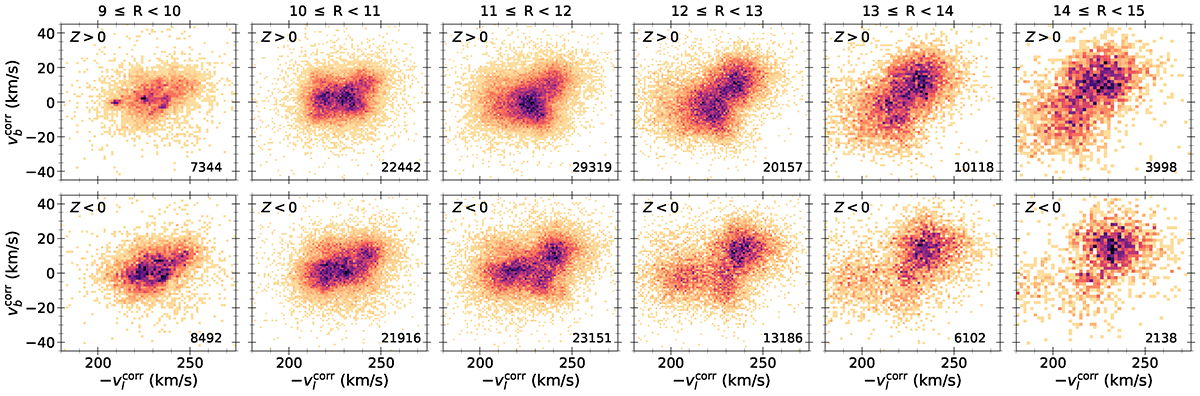
Density in the VZ ≡ ![]() vs.
vs. ![]() velocity map for several Galactocentric radial bins for the pP50 sample restricted around the AC (170° ≤l ≤ 190°). The two rows distinguish ZGal > 0 (above) from ZGal < 0 (below). All panels share both axes. The colour indicates stellar counts normalised to the densest bin of each panel in the sense that darker means denser. Bin sizes have been adapted to the number of stars of each panel (numbers shown at bottom right corners).
velocity map for several Galactocentric radial bins for the pP50 sample restricted around the AC (170° ≤l ≤ 190°). The two rows distinguish ZGal > 0 (above) from ZGal < 0 (below). All panels share both axes. The colour indicates stellar counts normalised to the densest bin of each panel in the sense that darker means denser. Bin sizes have been adapted to the number of stars of each panel (numbers shown at bottom right corners).
Current usage metrics show cumulative count of Article Views (full-text article views including HTML views, PDF and ePub downloads, according to the available data) and Abstracts Views on Vision4Press platform.
Data correspond to usage on the plateform after 2015. The current usage metrics is available 48-96 hours after online publication and is updated daily on week days.
Initial download of the metrics may take a while.