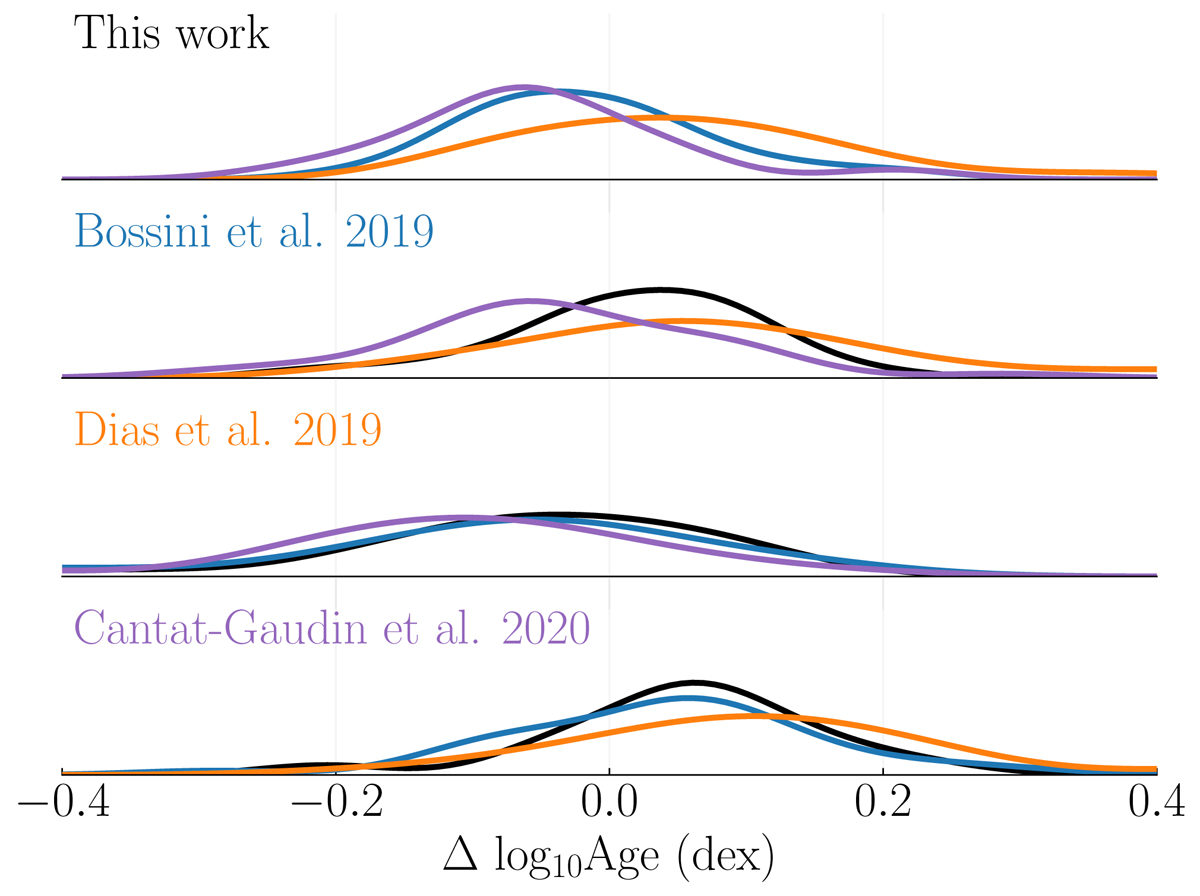
Fig. A.2.
Download original image
Distribution of logAge differences between this study (in black) and the studies by Bossini et al. (2019) (in blue), Dias et al. (2019) (in orange), and Cantat-Gaudin et al. (2020) (in purple). The distributions are obtained via a KDE, using Scott’s rule (Scott 1979) to determine the bandwidth. The bottom three panels show the distribution of logAge differences for the remaining surveys against the other three, respectively. Using this comparison, we find no systematic differences in estimated ages across the four presented methods.
Current usage metrics show cumulative count of Article Views (full-text article views including HTML views, PDF and ePub downloads, according to the available data) and Abstracts Views on Vision4Press platform.
Data correspond to usage on the plateform after 2015. The current usage metrics is available 48-96 hours after online publication and is updated daily on week days.
Initial download of the metrics may take a while.