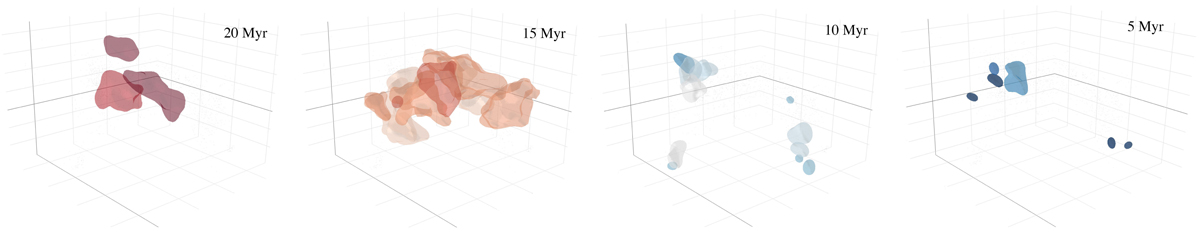
Fig. 4.
Download original image
Star formation progression in Sco-Cen, shown with the same orientation in XYZ and color-scaling as in Fig. 1. By separating the clusters in age bins, following the peaks in Fig. 3 and Table 2, one can appreciate a consistent inside-out progression of star formation from older to younger clusters. For more details, see the interactive 3D version online or at https://homepage.univie.ac.at/sebastian.ratzenboeck/wp-content/uploads/2023/05/scocen_age.html.
Current usage metrics show cumulative count of Article Views (full-text article views including HTML views, PDF and ePub downloads, according to the available data) and Abstracts Views on Vision4Press platform.
Data correspond to usage on the plateform after 2015. The current usage metrics is available 48-96 hours after online publication and is updated daily on week days.
Initial download of the metrics may take a while.