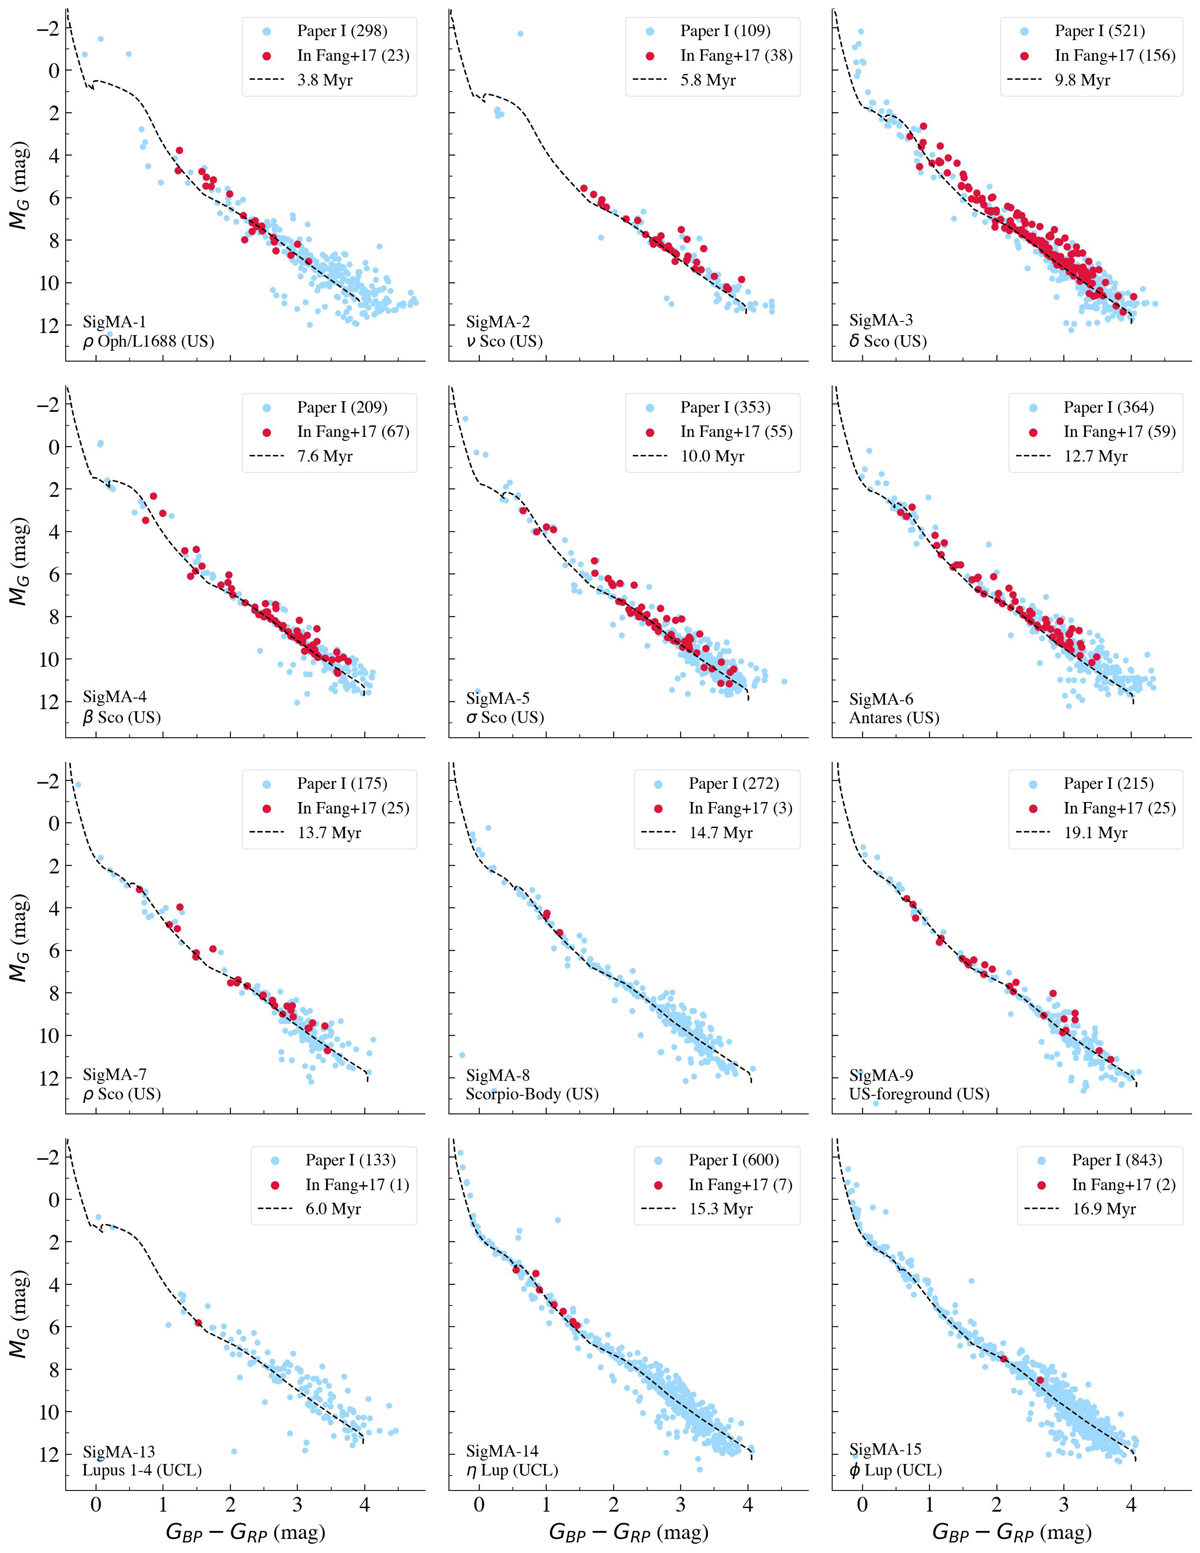
Fig. C.6.
Download original image
Gaia BPRP CMD showing the 12 SigMA clusters that have matches with sources from F17. Similar to Fig. 6, but now the individual clusters are displayed in separate panels. The sample includes nine clusters from USco and three clusters from UCL (bottom row), as assigned based on traditional borders (see Paper I). The three UCL clusters have only a few matches since they only partially reach into the USco region. The blue dots are the SigMA members of the respective clusters with additional photometric quality criteria (see Sect. 5.3). The red dots mark the sources that match with the F17 sample. We do not use the RUWE cut for this overview, which reveals some binary sequences. The dashed black line shows the PARSEC isochrone for the cluster age as estimated in this work (see legends).
Current usage metrics show cumulative count of Article Views (full-text article views including HTML views, PDF and ePub downloads, according to the available data) and Abstracts Views on Vision4Press platform.
Data correspond to usage on the plateform after 2015. The current usage metrics is available 48-96 hours after online publication and is updated daily on week days.
Initial download of the metrics may take a while.