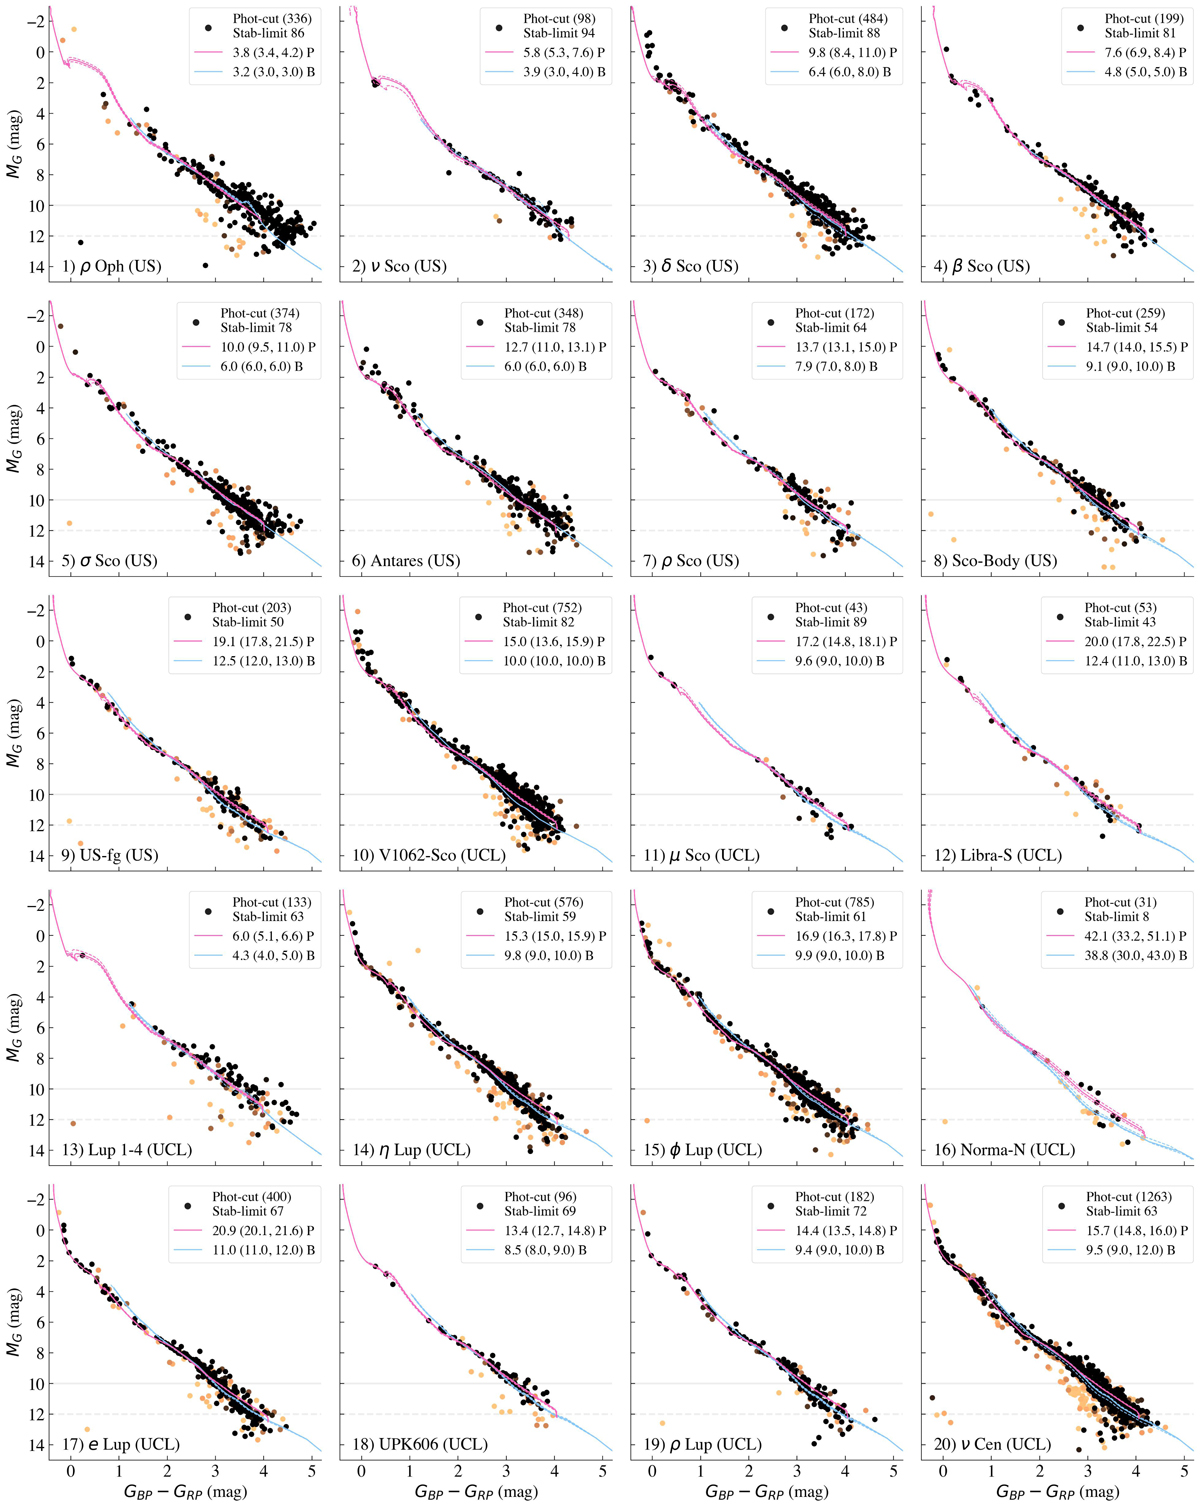
Fig. C.2.
Download original image
Gaia BPRP CMDs for the SigMA clusters 1–20. Only cluster members, which pass the photometric quality criteria from Eq. (2) are plotted, with the remaining number of sources given in the legend (Phot-cut). The dots are color-coded for stability with lower limits set to 2.5% (orange) and upper limits (dark) are varied per cluster, as given in the legend (Stab-limit, %). The magenta and blue solid lines show the best-fitting PARSEC (P) and BHAC15 (B) isochrones, respectively, as determined for BPRP, and the dashed lines show the upper and lower age limits (age limits are given in parenthesis in the legend). The horizontal solid and dashed light-gray lines give the magnitude limits at MG > 10 mag and MG > 12 mag for PARSEC and BHAC15, respectively, used to exclude sources from the age fitting.
Current usage metrics show cumulative count of Article Views (full-text article views including HTML views, PDF and ePub downloads, according to the available data) and Abstracts Views on Vision4Press platform.
Data correspond to usage on the plateform after 2015. The current usage metrics is available 48-96 hours after online publication and is updated daily on week days.
Initial download of the metrics may take a while.