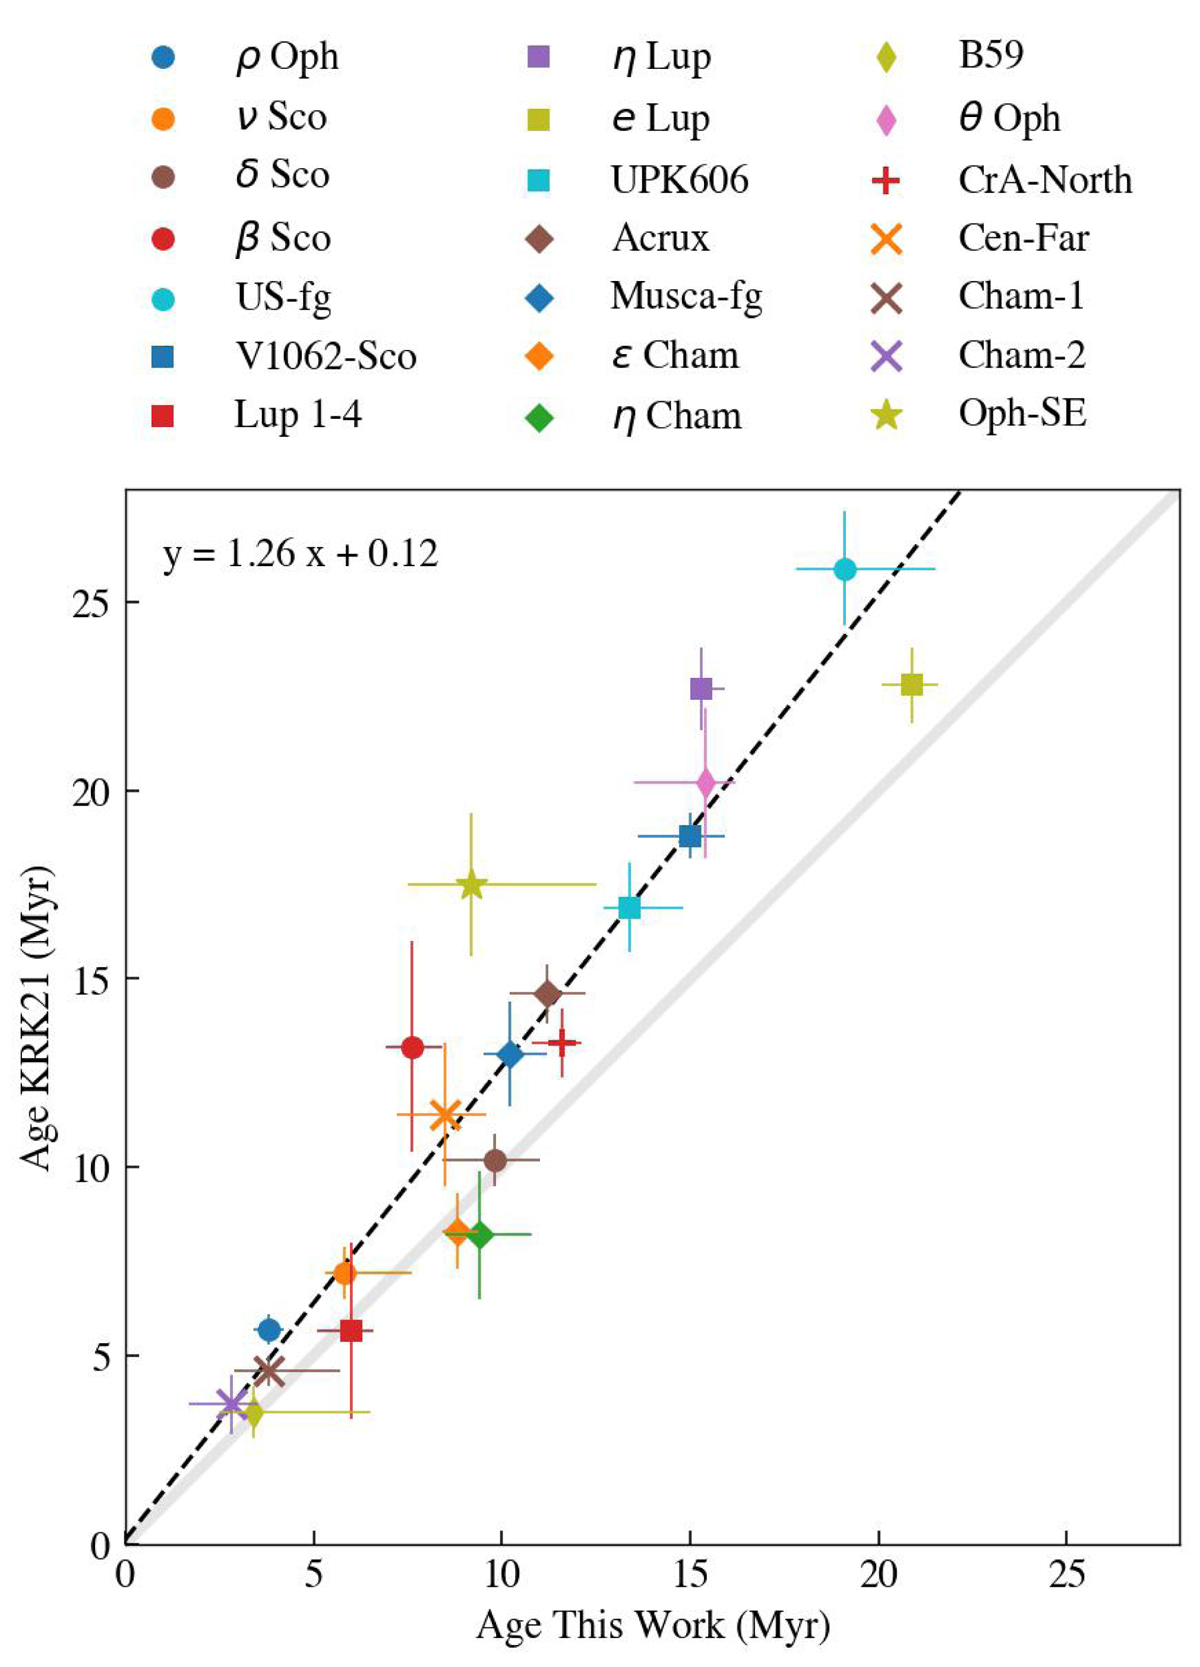
Fig. B.1.
Download original image
Comparison of the cluster ages from this work (using PARSEC-BPRP) to ages from KRK21. Only clusters with sufficient overlap between the two samples are shown (see text for more information). The solid gray line is a one-to-one line, and the black dashed line is a linear fit to the data points, as given in the panel. Individual clusters are marked with different colors and symbols (see legend), including error bars.
Current usage metrics show cumulative count of Article Views (full-text article views including HTML views, PDF and ePub downloads, according to the available data) and Abstracts Views on Vision4Press platform.
Data correspond to usage on the plateform after 2015. The current usage metrics is available 48-96 hours after online publication and is updated daily on week days.
Initial download of the metrics may take a while.