Fig. 6
Download original image
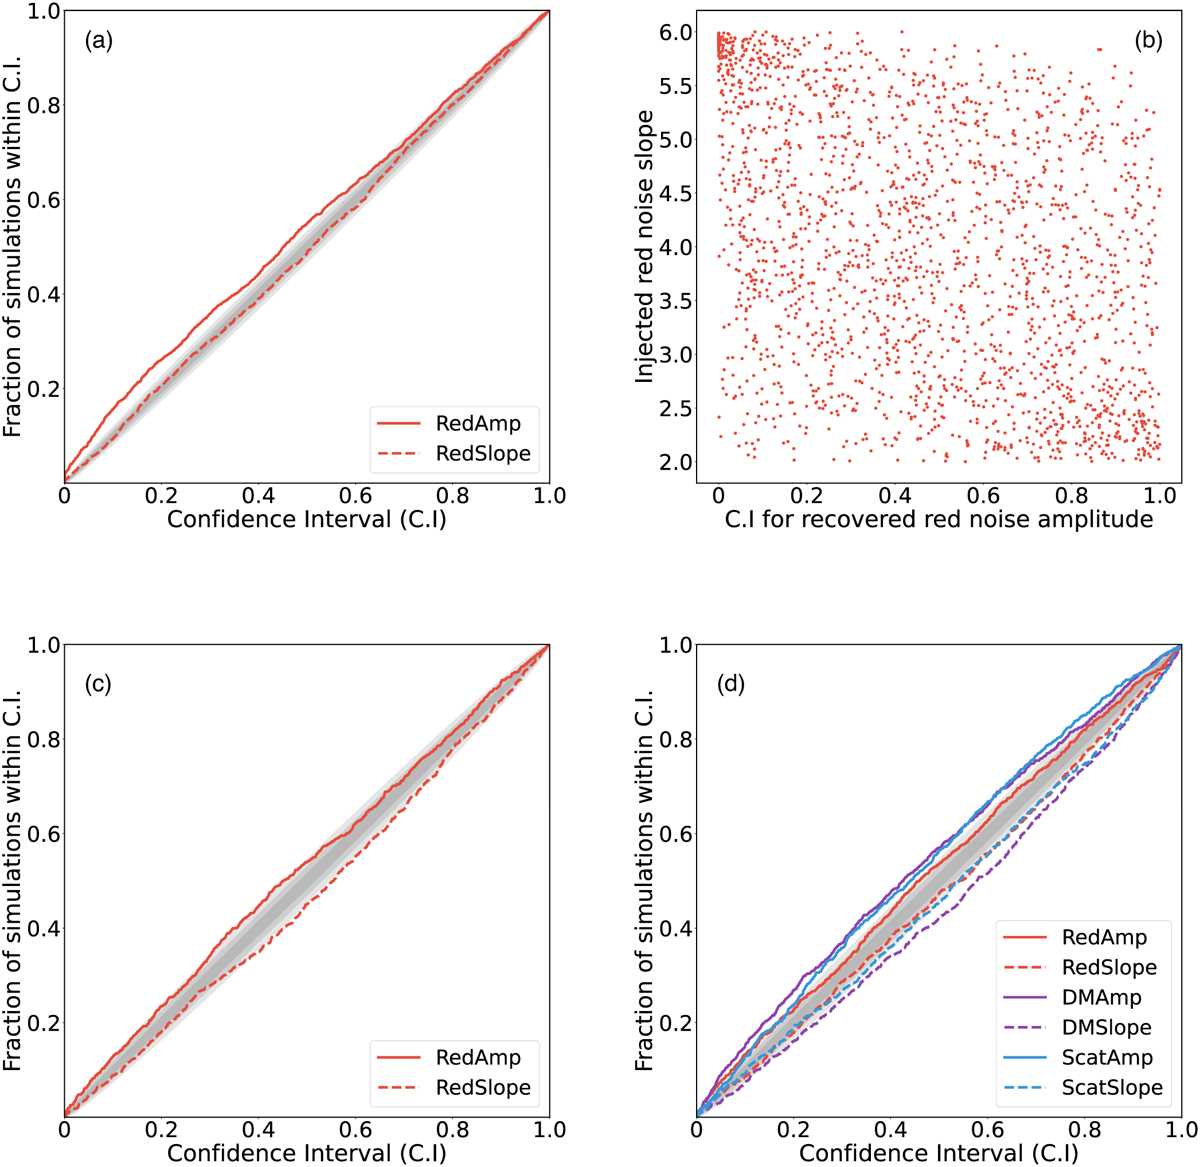
From top left to bottom right: (a) P–P plot for ~2000 simulations with only chromatic noise, injected at much lower than 1/Tspan; (b) the confidence interval of the recovered achromatic amplitude for various levels of injected red noise slope for the simulations is shown in (a); (c) P–P plot for ~1000 simulations with only chromatic noise periodic on 1/Tspan; (d) P–P plot for ~1000 simulations with chromatic, achromatic and scattering variations, periodic on 1/Tspan.
Current usage metrics show cumulative count of Article Views (full-text article views including HTML views, PDF and ePub downloads, according to the available data) and Abstracts Views on Vision4Press platform.
Data correspond to usage on the plateform after 2015. The current usage metrics is available 48-96 hours after online publication and is updated daily on week days.
Initial download of the metrics may take a while.