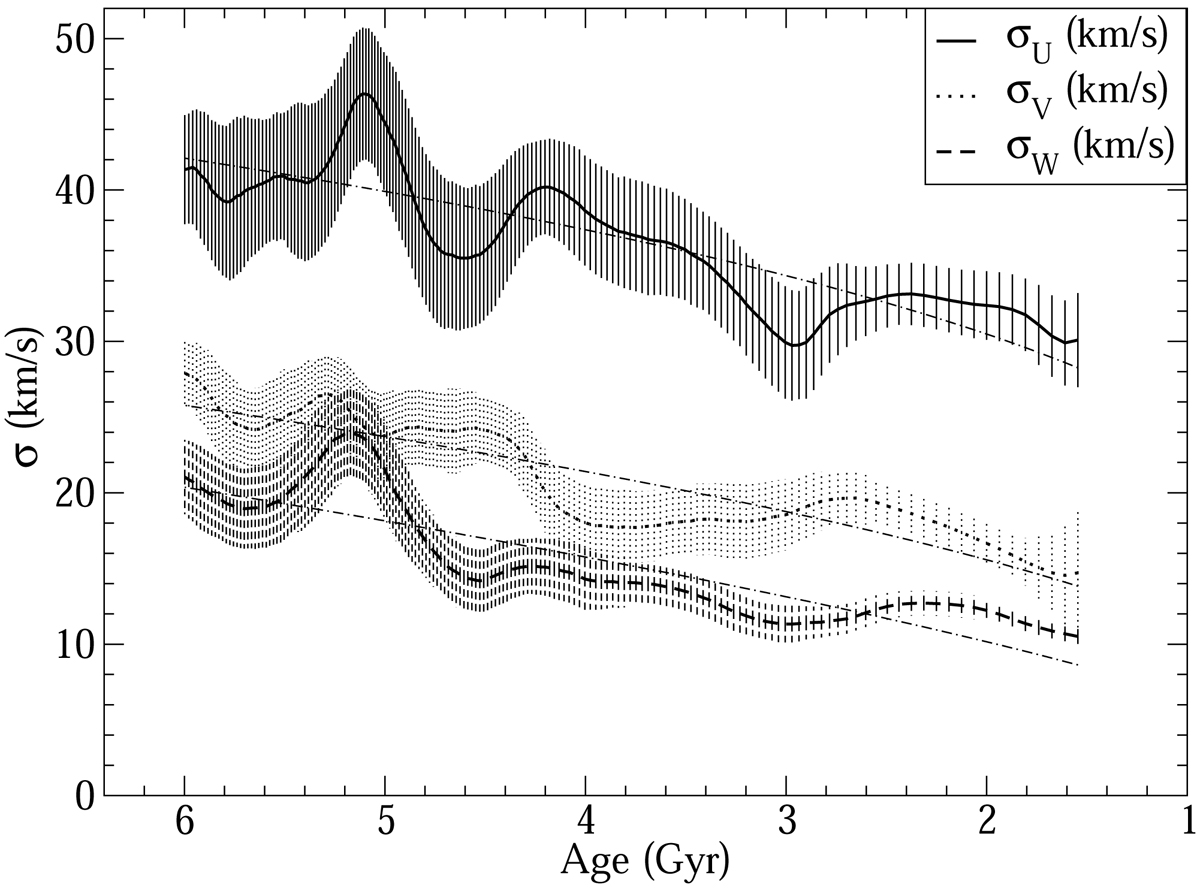
Fig. 7.
Download original image
Standard deviation of the U, V, and W velocity components of the sample stars in age bins of 20 stars as a function of the average age of the stars in those bins. The vertical bars represent the ±1σ errors on the mean standard deviation of the velocity components. The dot-dashed lines are best-fit power laws to the time evolution of the velocity component dispersions of all sample stars.
Current usage metrics show cumulative count of Article Views (full-text article views including HTML views, PDF and ePub downloads, according to the available data) and Abstracts Views on Vision4Press platform.
Data correspond to usage on the plateform after 2015. The current usage metrics is available 48-96 hours after online publication and is updated daily on week days.
Initial download of the metrics may take a while.