Fig. 3.
Download original image
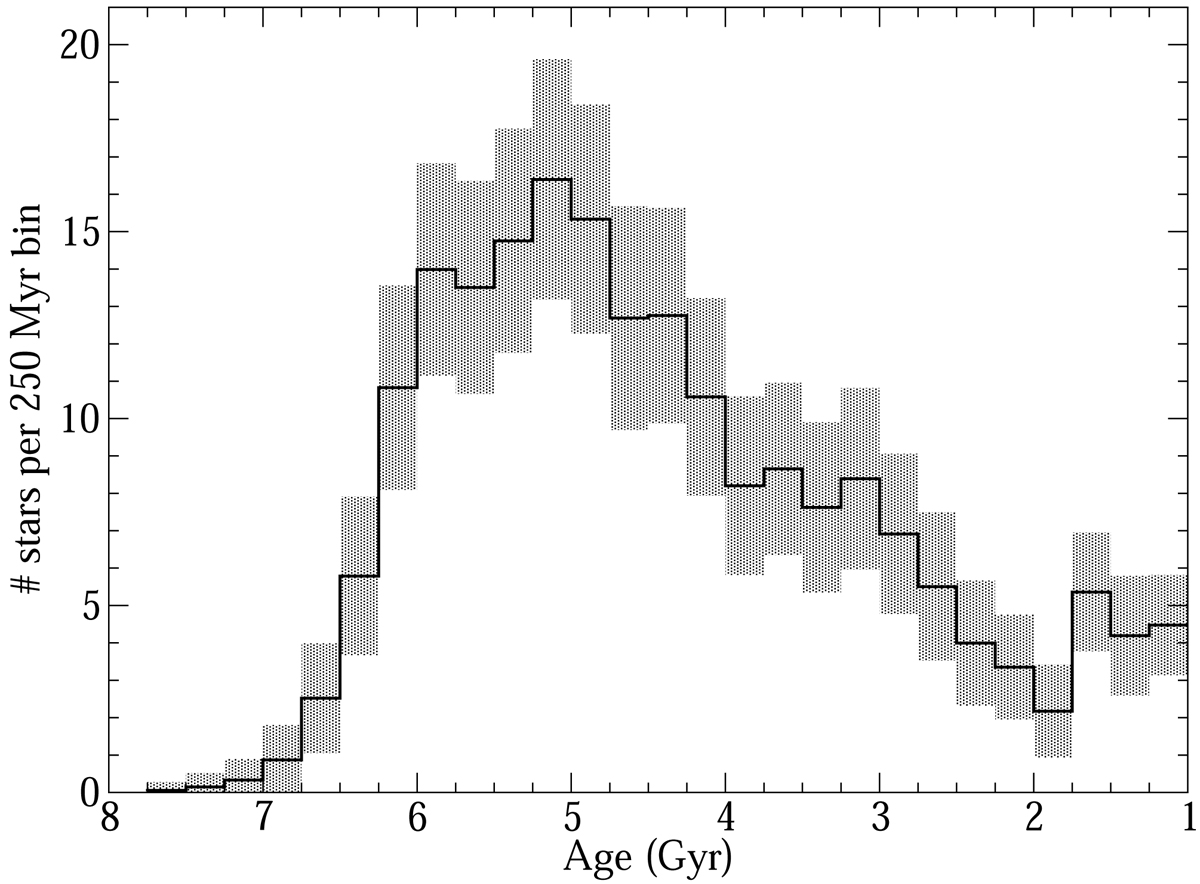
Age distributions derived by inverting the ![]() index distributions of all sample stars. The grey areas represent the ±1σ envelopes of 1000 realisations of the age distributions assuming Gaussian distributions of the mass and average
index distributions of all sample stars. The grey areas represent the ±1σ envelopes of 1000 realisations of the age distributions assuming Gaussian distributions of the mass and average ![]() index of each star around the average values provided in the AMBRE-HARPS catalogue of
index of each star around the average values provided in the AMBRE-HARPS catalogue of ![]() indices with the uncertainties given in the catalogue.
indices with the uncertainties given in the catalogue.
Current usage metrics show cumulative count of Article Views (full-text article views including HTML views, PDF and ePub downloads, according to the available data) and Abstracts Views on Vision4Press platform.
Data correspond to usage on the plateform after 2015. The current usage metrics is available 48-96 hours after online publication and is updated daily on week days.
Initial download of the metrics may take a while.