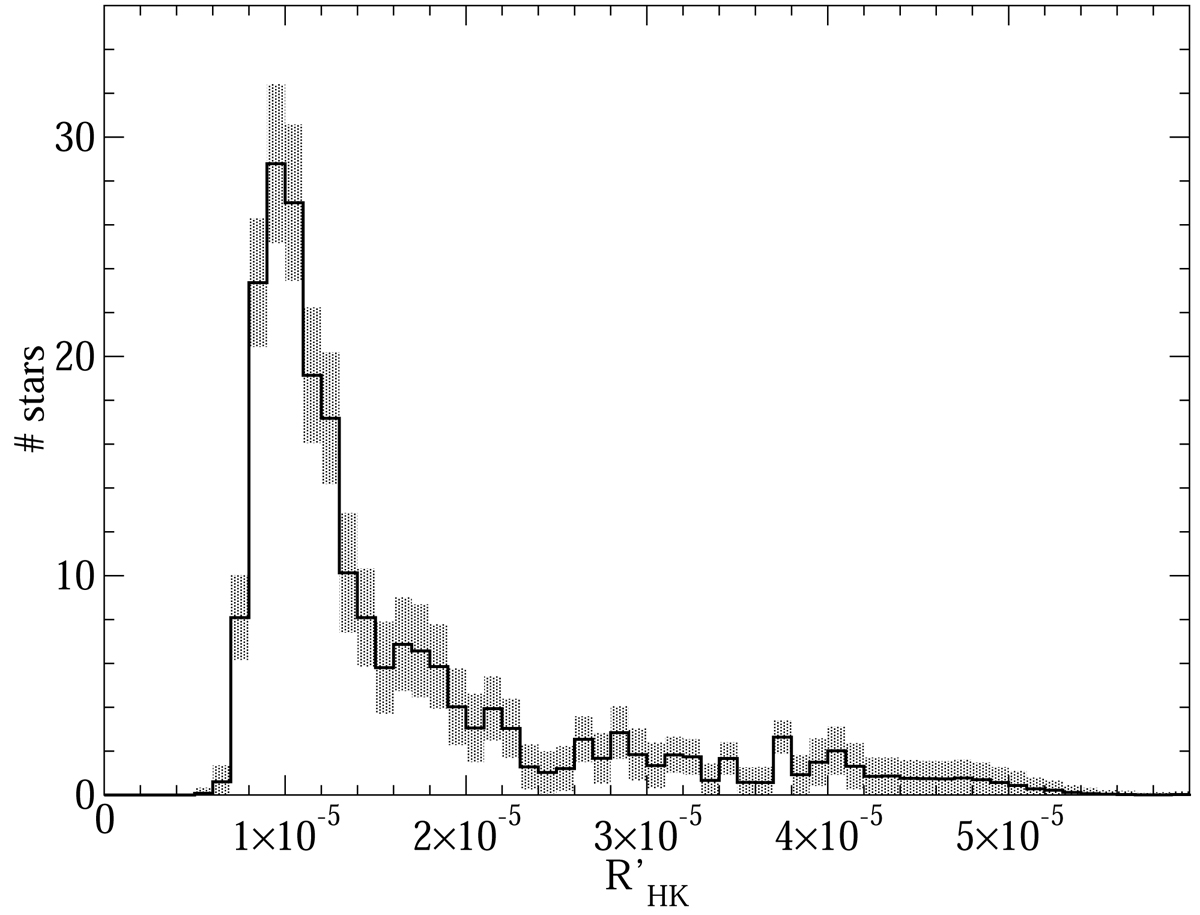
Fig. 2.
Download original image
Mean ⟨R′HK⟩ index distribution of all sample stars. The grey areas represent the ±1σ envelopes of the histograms of 1000 realisations of the distribution of R′HK indices of the sample stars assuming a Gaussian distribution around the mean measurement values with the uncertainties provided in the AMBER-HARPS catalogue of ![]() indices (Gomes da Silva et al. 2021).
indices (Gomes da Silva et al. 2021).
Current usage metrics show cumulative count of Article Views (full-text article views including HTML views, PDF and ePub downloads, according to the available data) and Abstracts Views on Vision4Press platform.
Data correspond to usage on the plateform after 2015. The current usage metrics is available 48-96 hours after online publication and is updated daily on week days.
Initial download of the metrics may take a while.