Open Access
Fig. 1.
Download original image
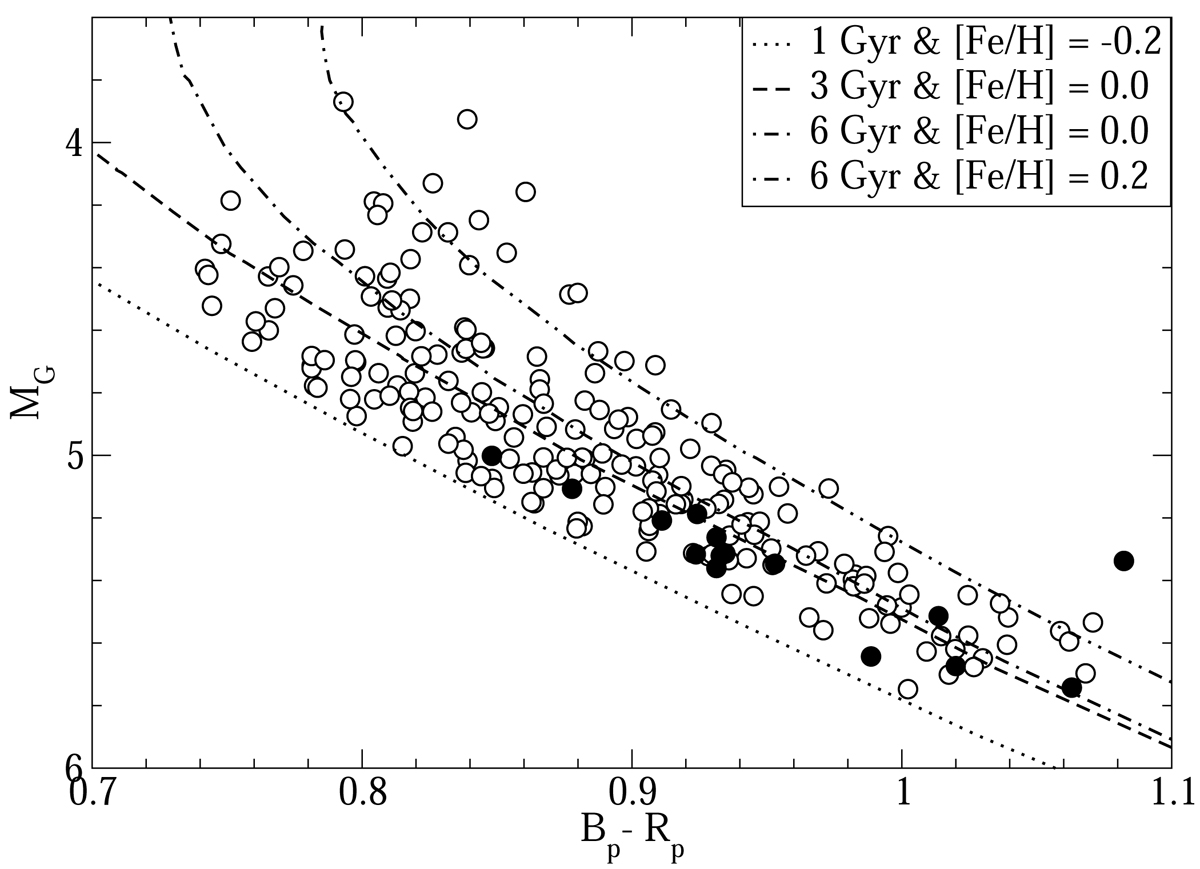
Colour–magnitude diagram of the sample stars compared with the PARSEC isochrones (Bressan et al. 2012) projected into the Gaia eDR3 photometric system (Evans et al. 2018). The filled circles indicate stars with ![]() (i.e. the most active stars in the sample).
(i.e. the most active stars in the sample).
Current usage metrics show cumulative count of Article Views (full-text article views including HTML views, PDF and ePub downloads, according to the available data) and Abstracts Views on Vision4Press platform.
Data correspond to usage on the plateform after 2015. The current usage metrics is available 48-96 hours after online publication and is updated daily on week days.
Initial download of the metrics may take a while.