Fig. 3.
Download original image
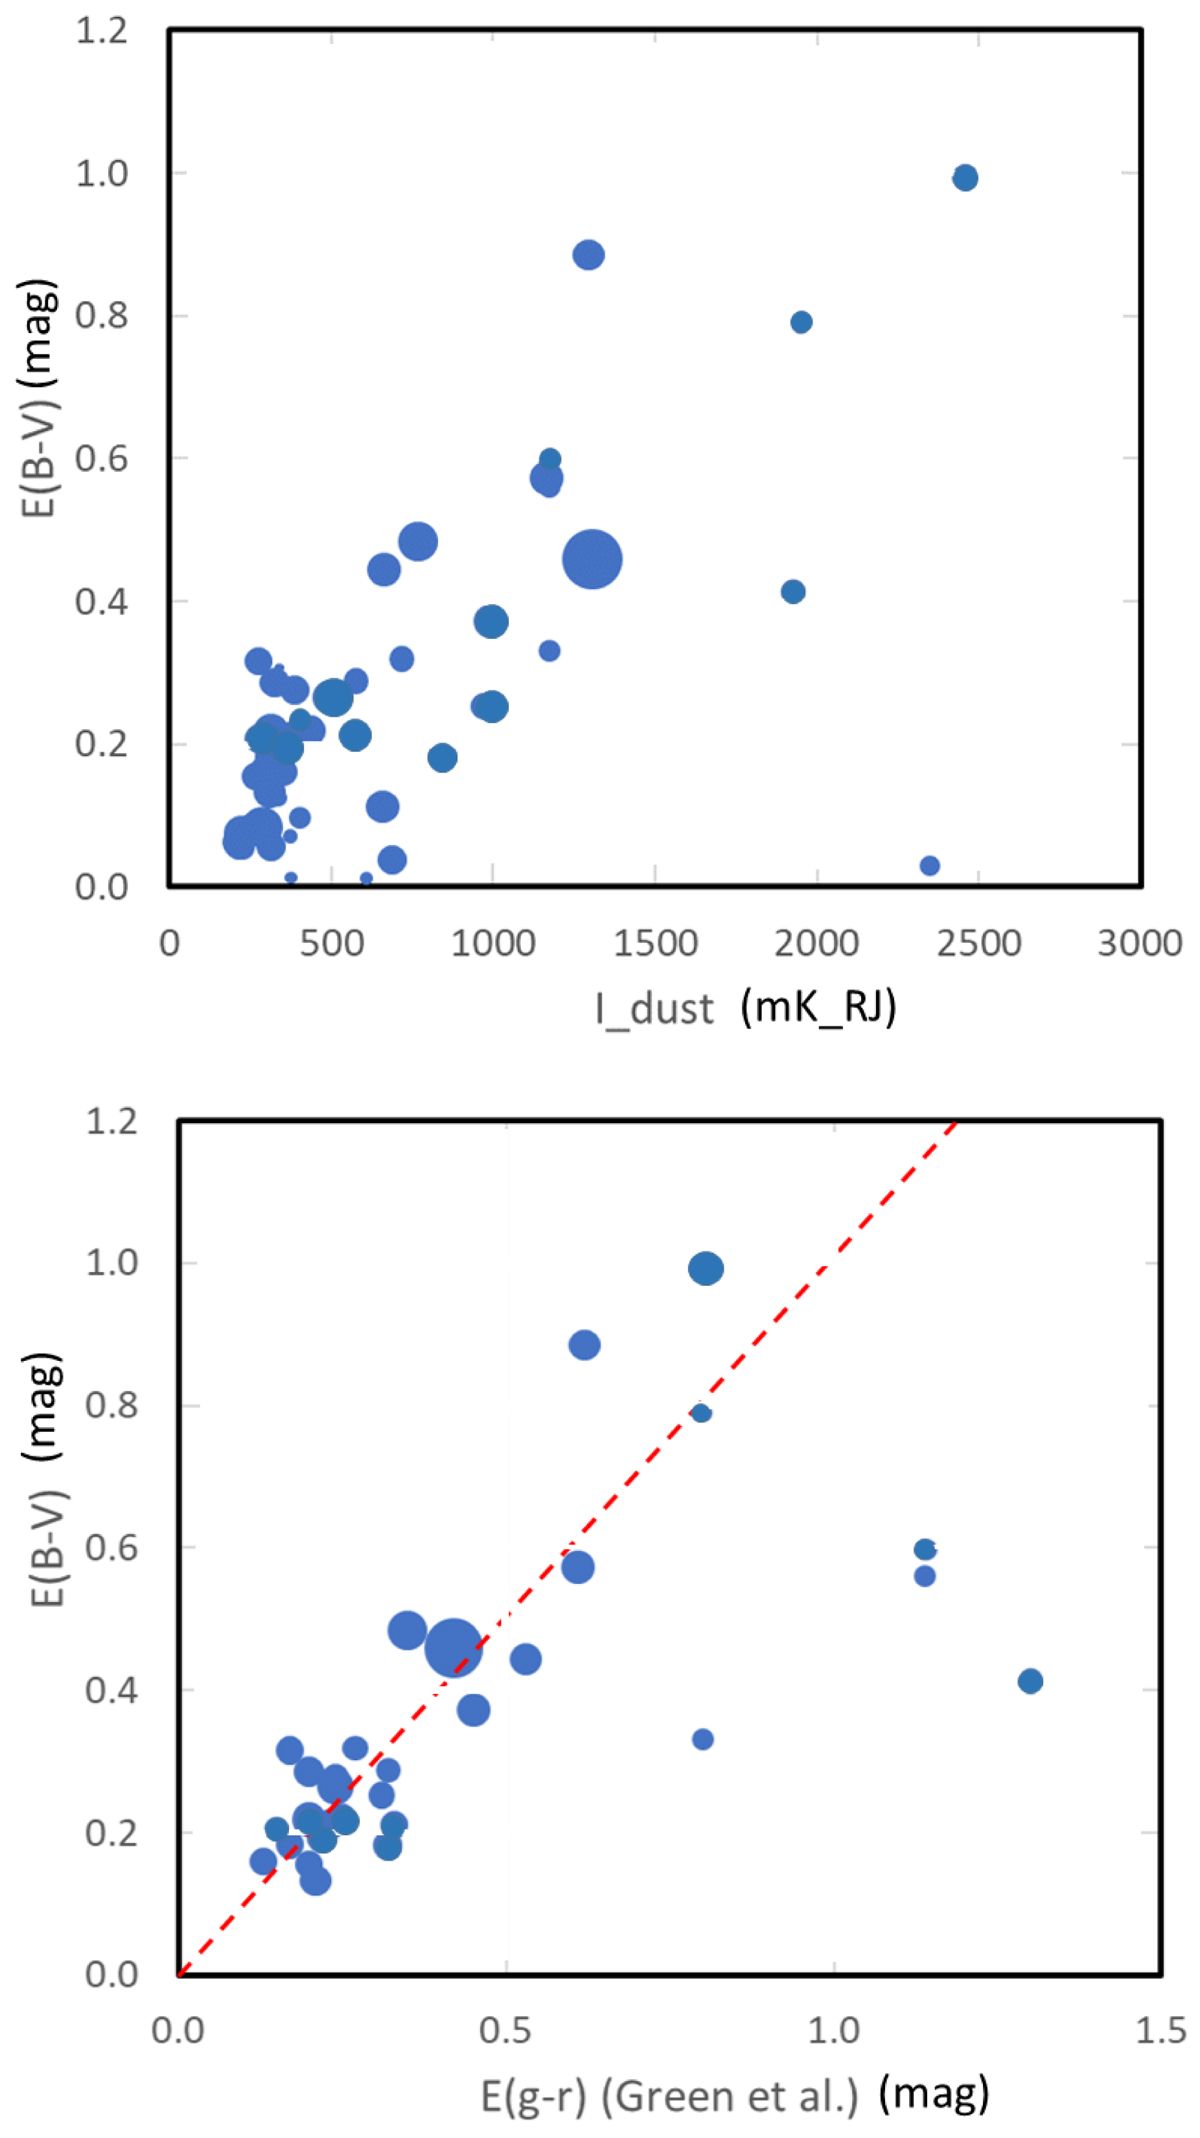
Comparison between the reddening assumed for the programme stars in the region of the Upper Scorpius – Ophiuchus cloud and other estimates. Upper panel: with the intensity of the emission as measured by the Planck mission. Lower panel: with the total reddening in the g − r colour and in that direction obtained from the map by Green et al. (2019); the dashed red line is the expected relation between E(B − V) and E(g − r) (Schlafly & Finkbeiner 2011). Only objects with E(B − V) > 0.1 are plotted here. In both panels the size of the points is related to the distance from the Sun (largest symbols are for the farthest stars).
Current usage metrics show cumulative count of Article Views (full-text article views including HTML views, PDF and ePub downloads, according to the available data) and Abstracts Views on Vision4Press platform.
Data correspond to usage on the plateform after 2015. The current usage metrics is available 48-96 hours after online publication and is updated daily on week days.
Initial download of the metrics may take a while.