Open Access
Fig. A.3.
Download original image
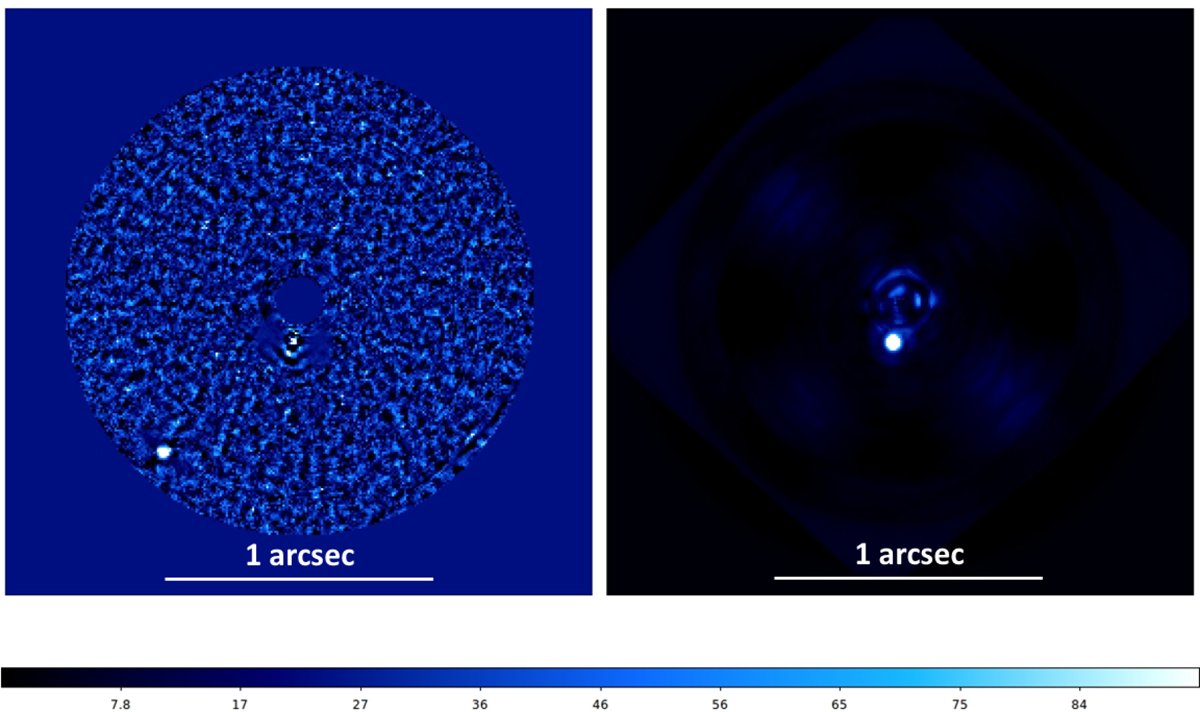
Images for HIP6009. Left: S/N map obtained on the SPHERE IFS data for HIP60009 analysed with PCA ASDI; right: The same data set after simple subtraction of a radial profile. The colour scale represents the S/N value on the left image, and an arbitrary relative intensity on the right
Current usage metrics show cumulative count of Article Views (full-text article views including HTML views, PDF and ePub downloads, according to the available data) and Abstracts Views on Vision4Press platform.
Data correspond to usage on the plateform after 2015. The current usage metrics is available 48-96 hours after online publication and is updated daily on week days.
Initial download of the metrics may take a while.