Fig. 15.
Download original image
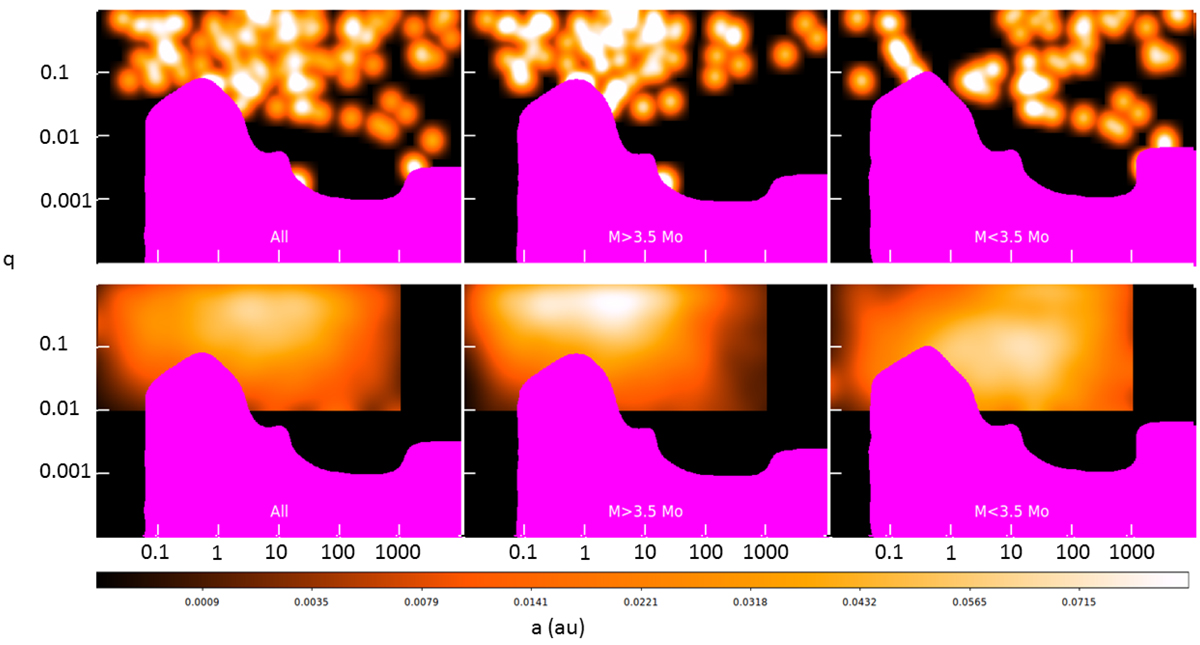
Comparison between observed (top row) and model (bottom row) maps of the smoothed distribution of companions in the separation (in au) vs mass ratio plane. We consider here the maps obtained considering only the closest companion, for consistency between the models and the observations. Left column is the whole sample; central column is for stars with a mass > 3.5 M⊙; right column is for stars with a mass < 3.5 M⊙. The magenta area marks the region with completeness < 0.2, not used in the analysis.
Current usage metrics show cumulative count of Article Views (full-text article views including HTML views, PDF and ePub downloads, according to the available data) and Abstracts Views on Vision4Press platform.
Data correspond to usage on the plateform after 2015. The current usage metrics is available 48-96 hours after online publication and is updated daily on week days.
Initial download of the metrics may take a while.