Fig. 14.
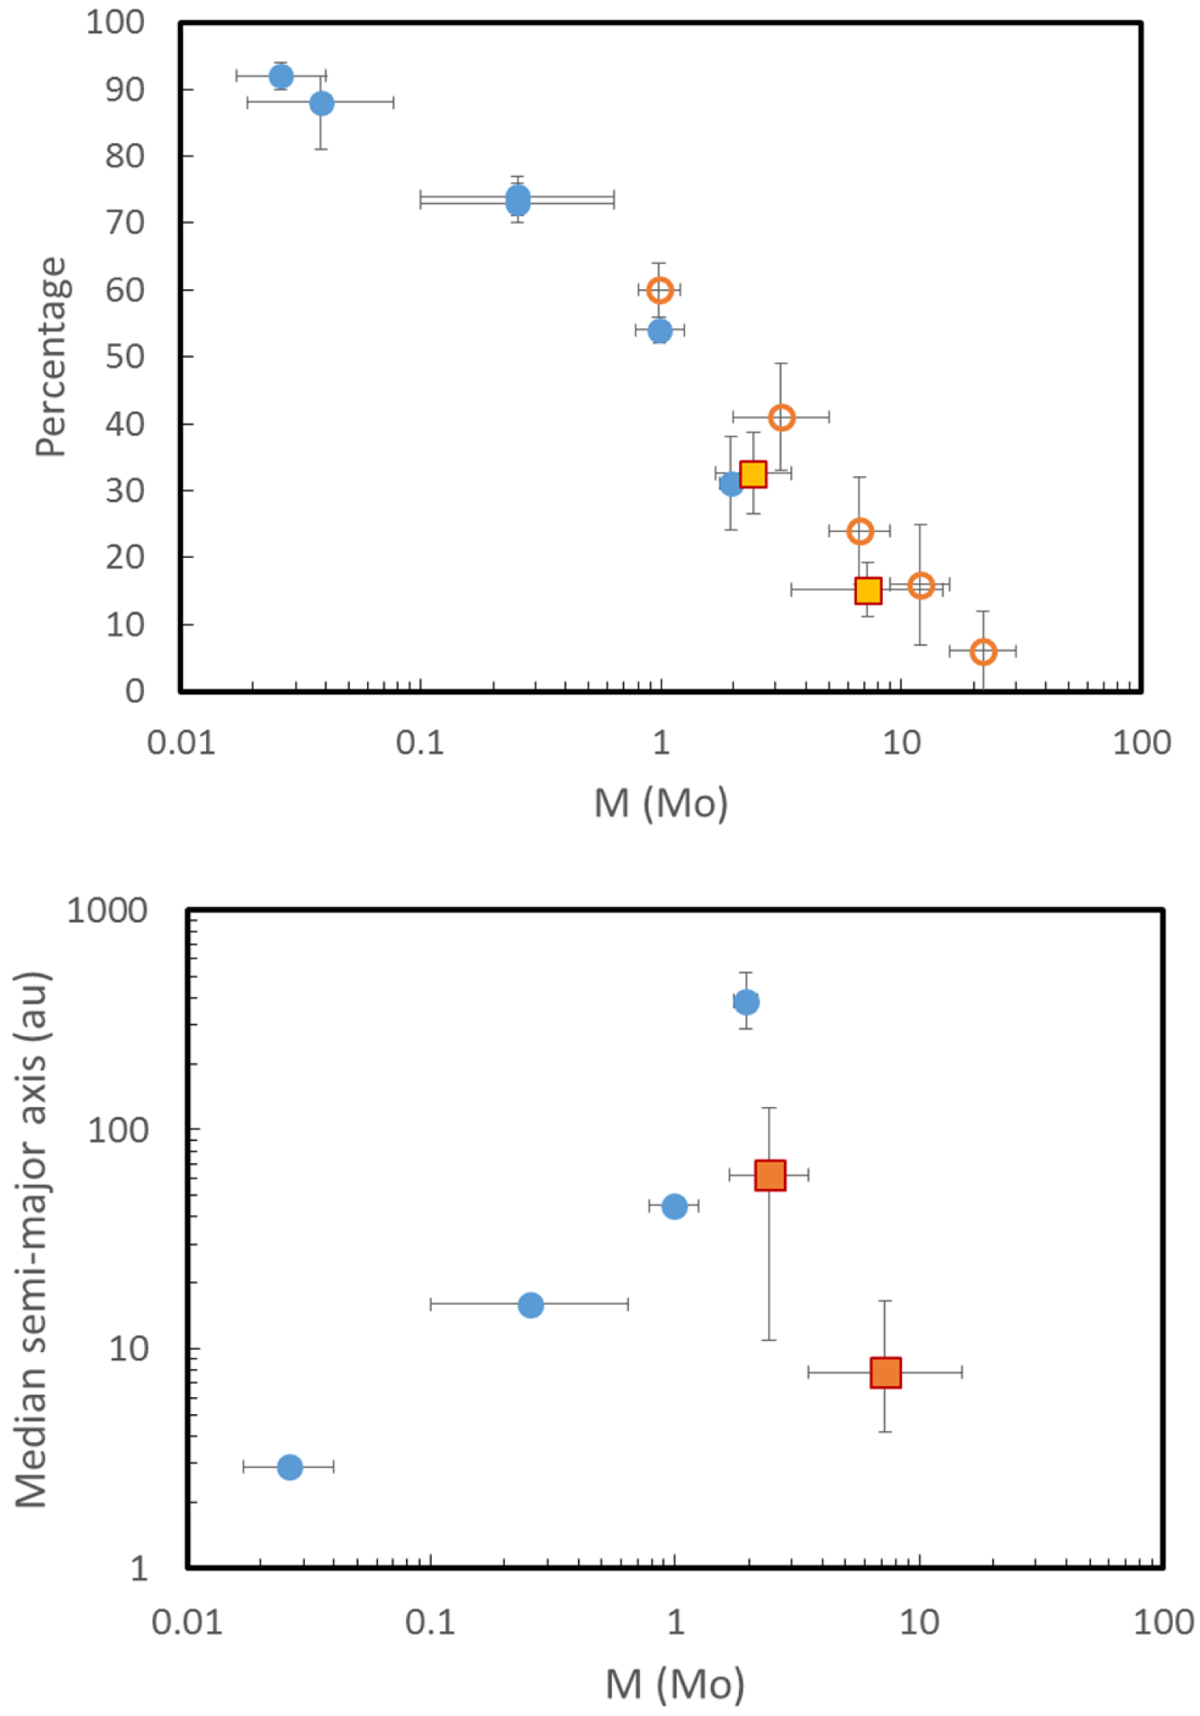
Download original image
Runs of statistical properties of binaries with the stellar mass. Upper panel: run of the frequency of single stars from our data (orange squares with red edge), the samples in Table 7 (filled circles) and from Moe & Di Stefano (2017; opens circles). Lower panel: run of the median semi-major axis. Horizontal error bars reproduce the mass range of the different samples
Current usage metrics show cumulative count of Article Views (full-text article views including HTML views, PDF and ePub downloads, according to the available data) and Abstracts Views on Vision4Press platform.
Data correspond to usage on the plateform after 2015. The current usage metrics is available 48-96 hours after online publication and is updated daily on week days.
Initial download of the metrics may take a while.