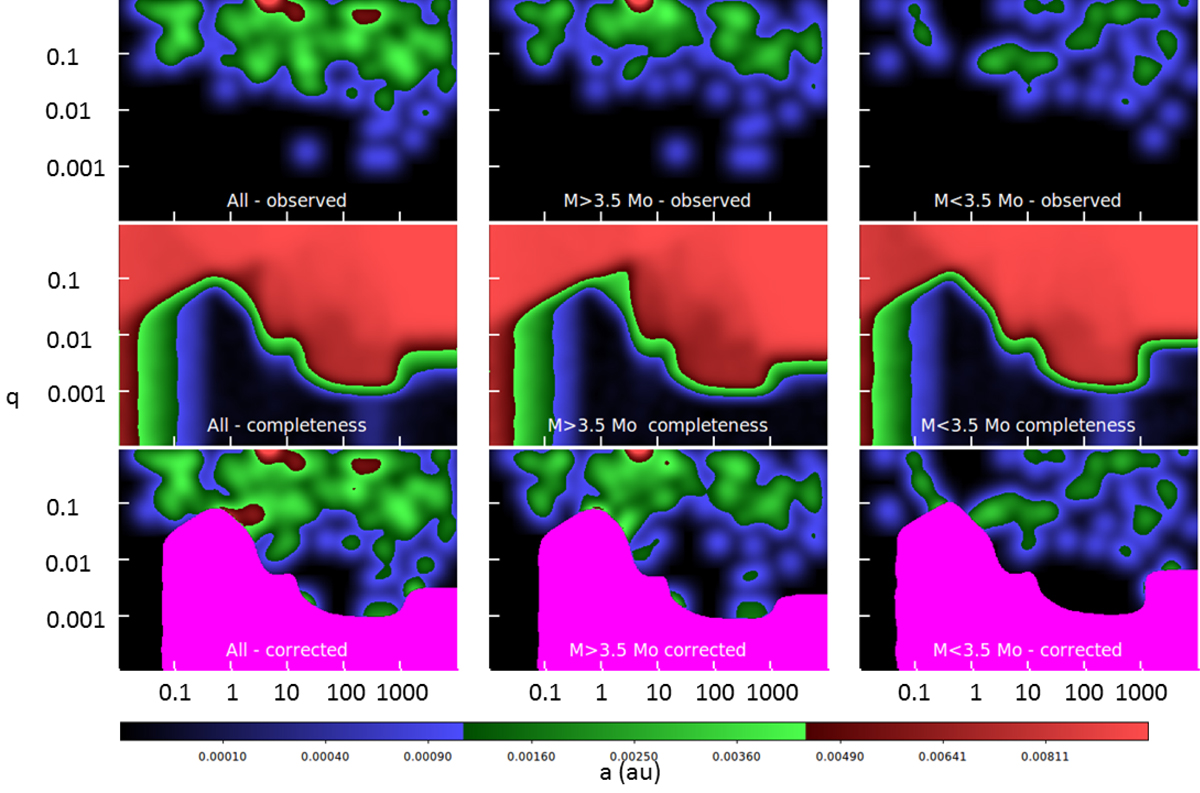
Fig. 10.
Download original image
Smoothed distribution of the companions in the semi-major axis a – mass ratio q plane. Top row: observed distribution. Middle row: detection completeness maps. Bottom row: observed distribution corrected for completeness. Left column gives results for the whole sample; the central column gives results from stars more massive than 3.5 M⊙; the right column for less massive stars. The magenta area in the lower row marks the region with completeness < 0.2, not used in the analysis.
Current usage metrics show cumulative count of Article Views (full-text article views including HTML views, PDF and ePub downloads, according to the available data) and Abstracts Views on Vision4Press platform.
Data correspond to usage on the plateform after 2015. The current usage metrics is available 48-96 hours after online publication and is updated daily on week days.
Initial download of the metrics may take a while.