Open Access
Fig. 7.
Download original image
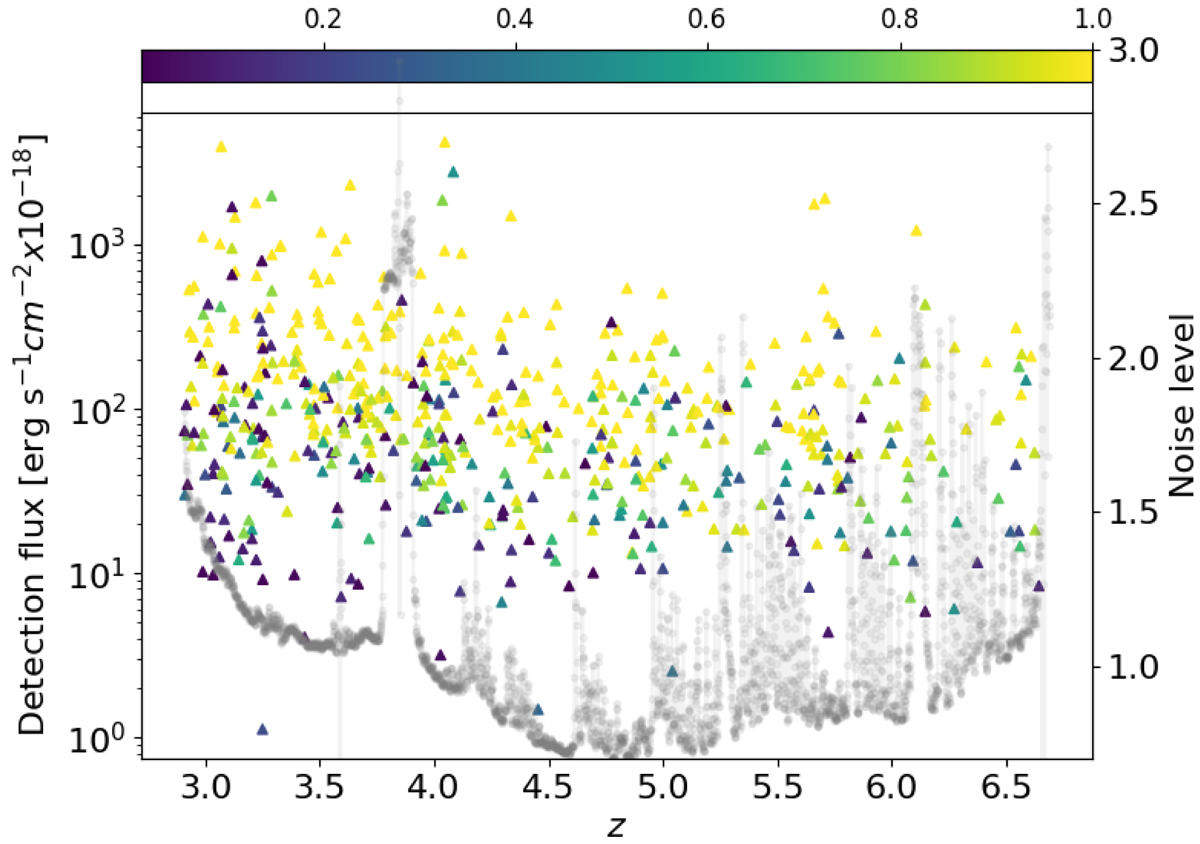
Detection flux vs. redshift for all sources in the present sample. The color bar on the top shows completeness value of each source in the sample. The grey points show the evolution of noise level as function of wavelength/redshift for the cluster MACS0257 as an example.
Current usage metrics show cumulative count of Article Views (full-text article views including HTML views, PDF and ePub downloads, according to the available data) and Abstracts Views on Vision4Press platform.
Data correspond to usage on the plateform after 2015. The current usage metrics is available 48-96 hours after online publication and is updated daily on week days.
Initial download of the metrics may take a while.