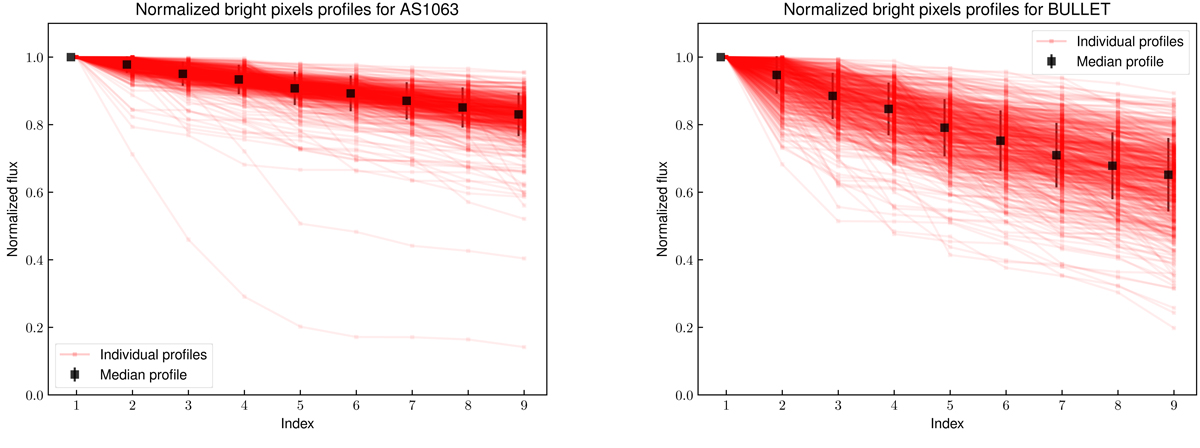
Fig. 5.
Download original image
Examples of normalized bright pixels profiles of sources from clusters AS1063 and BULLET. Individual profiles (red) are shown together with their median (black). Each of these median profiles is then used as a representative for all sources in that MUSE datacube. The different seeings between datacubes are taken into account when producing these profiles. The median profile and the RMS map are used to produce a wide range of S/N values for each MUSE datacube.
Current usage metrics show cumulative count of Article Views (full-text article views including HTML views, PDF and ePub downloads, according to the available data) and Abstracts Views on Vision4Press platform.
Data correspond to usage on the plateform after 2015. The current usage metrics is available 48-96 hours after online publication and is updated daily on week days.
Initial download of the metrics may take a while.