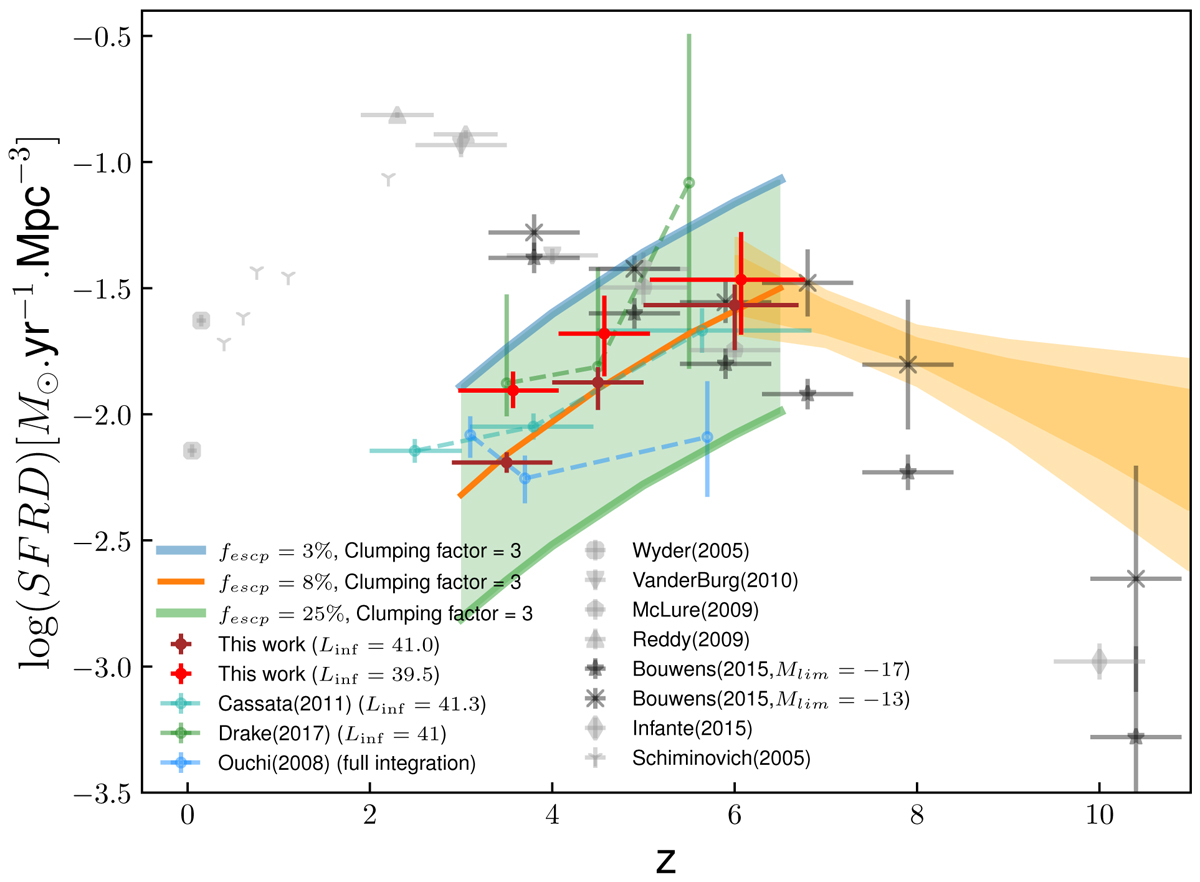
Fig. 15.
Download original image
Evolution of the star formation rate density with redshift using different integration limits for the LF. Brown (red) crosses show results of integrating the best-fit Schechter (modified Schechter) functions log(L) from 41 (39.5) to 44 erg s−1. Solid blue, orange, and green curves indicate the critical SFRDs obtained by assuming a clumping factor of 3 and fescp = 3%, 8%, and 25%, respectively. The solid green curve, having fescp = 8%, indicates the best likely match with our SFRD points in the luminosity range of 41 < log(L) < 44 (see details in the text).
Current usage metrics show cumulative count of Article Views (full-text article views including HTML views, PDF and ePub downloads, according to the available data) and Abstracts Views on Vision4Press platform.
Data correspond to usage on the plateform after 2015. The current usage metrics is available 48-96 hours after online publication and is updated daily on week days.
Initial download of the metrics may take a while.