Fig. 13.
Download original image
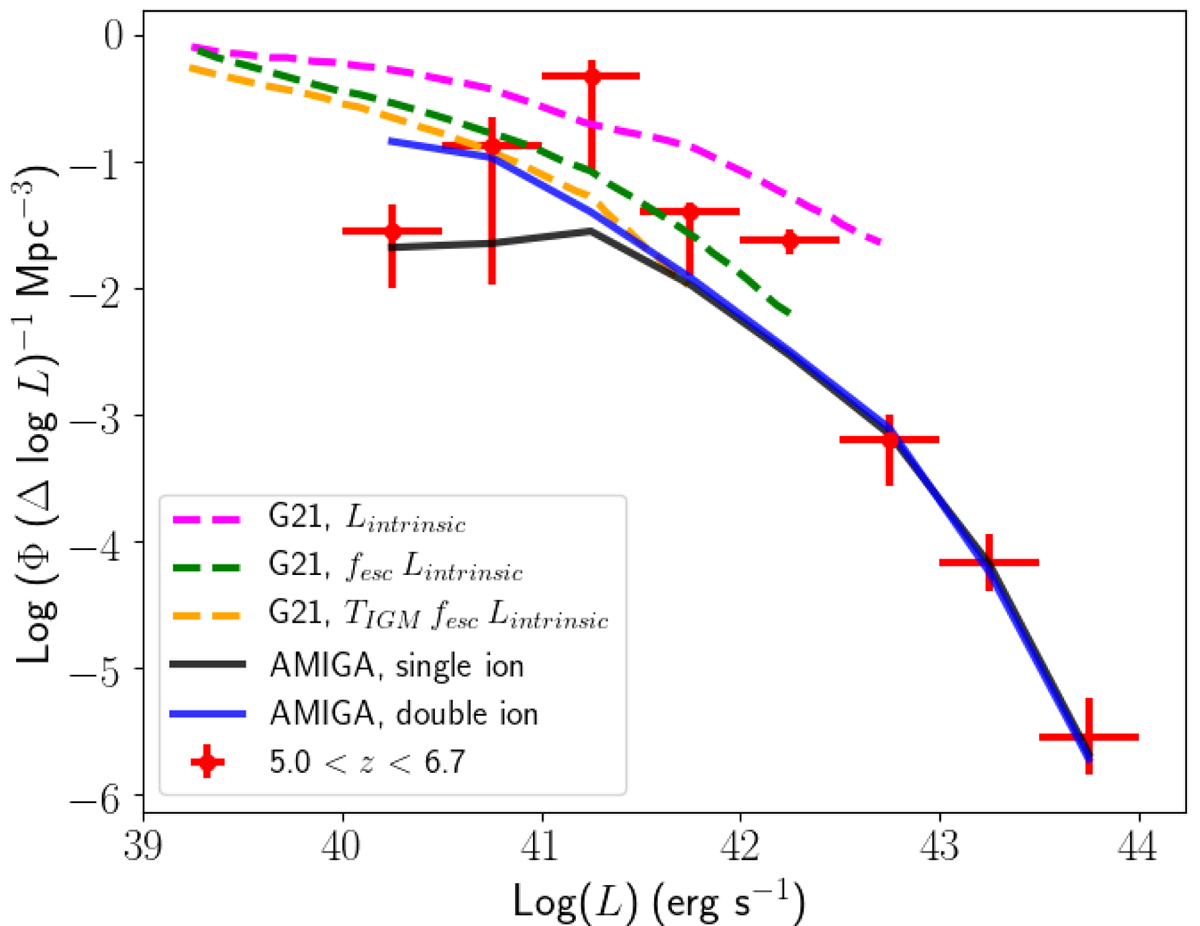
Comparison with model predictions. Red crosses show our reconstructed LF points in the redshift range of 5.0 < z < 6.7. Two additional crosses in the bright end, having log(L)[erg s−1] > 43, are taken from the literature, obtained the same way as described in Sect. 5.2. Black and blue solid lines show predictions from the AMIGA models with single- and double-ionization scenarios, respectively. Predicted LFs from the SPHINX simulation (Garel et al. 2021) are shown as dashed lines: intrinsic LF (magenta), attenuation by dust (green), and by IGM (orange).
Current usage metrics show cumulative count of Article Views (full-text article views including HTML views, PDF and ePub downloads, according to the available data) and Abstracts Views on Vision4Press platform.
Data correspond to usage on the plateform after 2015. The current usage metrics is available 48-96 hours after online publication and is updated daily on week days.
Initial download of the metrics may take a while.