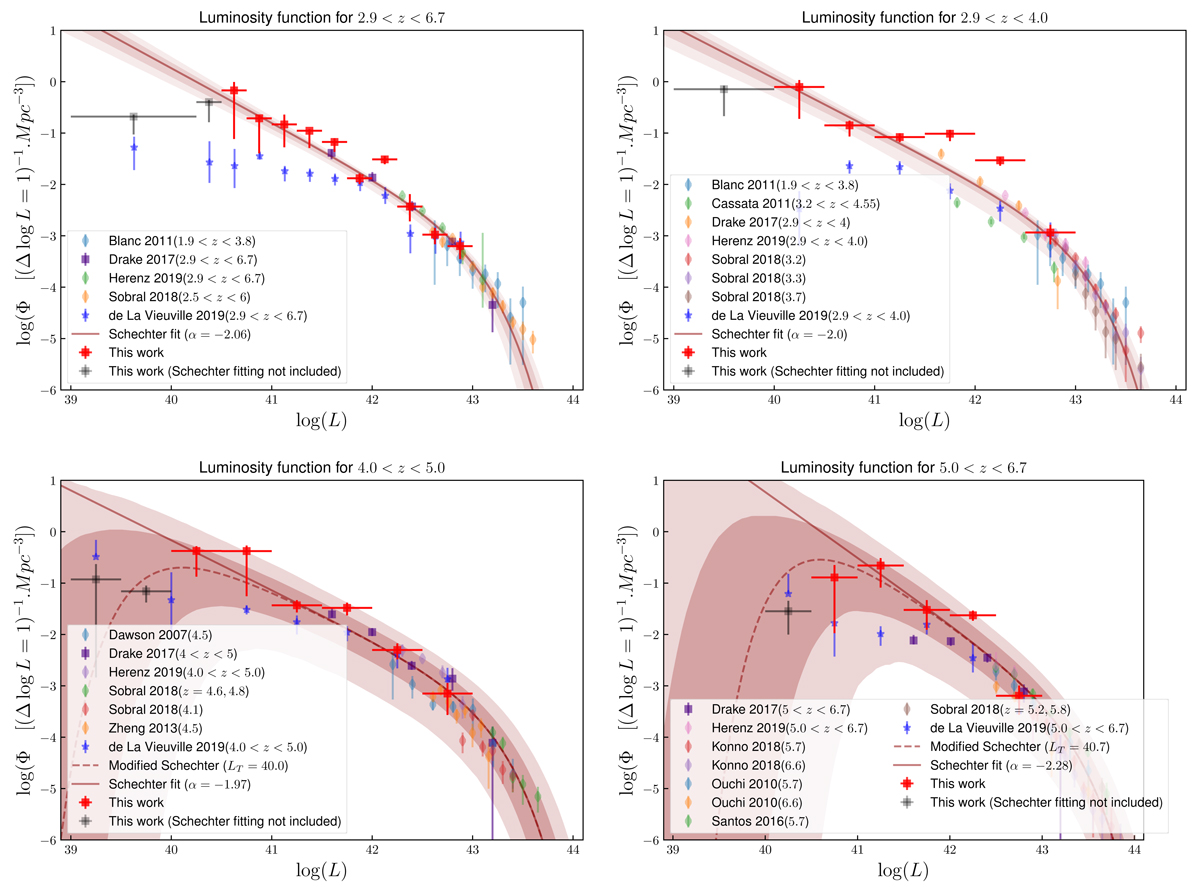
Fig. 10.
Download original image
LF points and their fits for different redshift intervals including previous literature data points. The red squares are the points from the present work. The literature points at the bright end of the LF: Ouchi et al. (2010), Sobral et al. (2018), Zheng et al. (2013), Herenz et al. (2019), and Drake et al. (2017) have been used for the fitting. The blue points DLV19 are shown for comparison purpose only. The best fits (Schechter function) are shown as a solid line and the 68% and 95% confidence areas as dark-red colored regions, respectively. The dashed lines shown in lower panels are modified Schechter functions to account for a possible turnover at faint luminosity bins (see details in the text).
Current usage metrics show cumulative count of Article Views (full-text article views including HTML views, PDF and ePub downloads, according to the available data) and Abstracts Views on Vision4Press platform.
Data correspond to usage on the plateform after 2015. The current usage metrics is available 48-96 hours after online publication and is updated daily on week days.
Initial download of the metrics may take a while.