Fig. 7.
Download original image
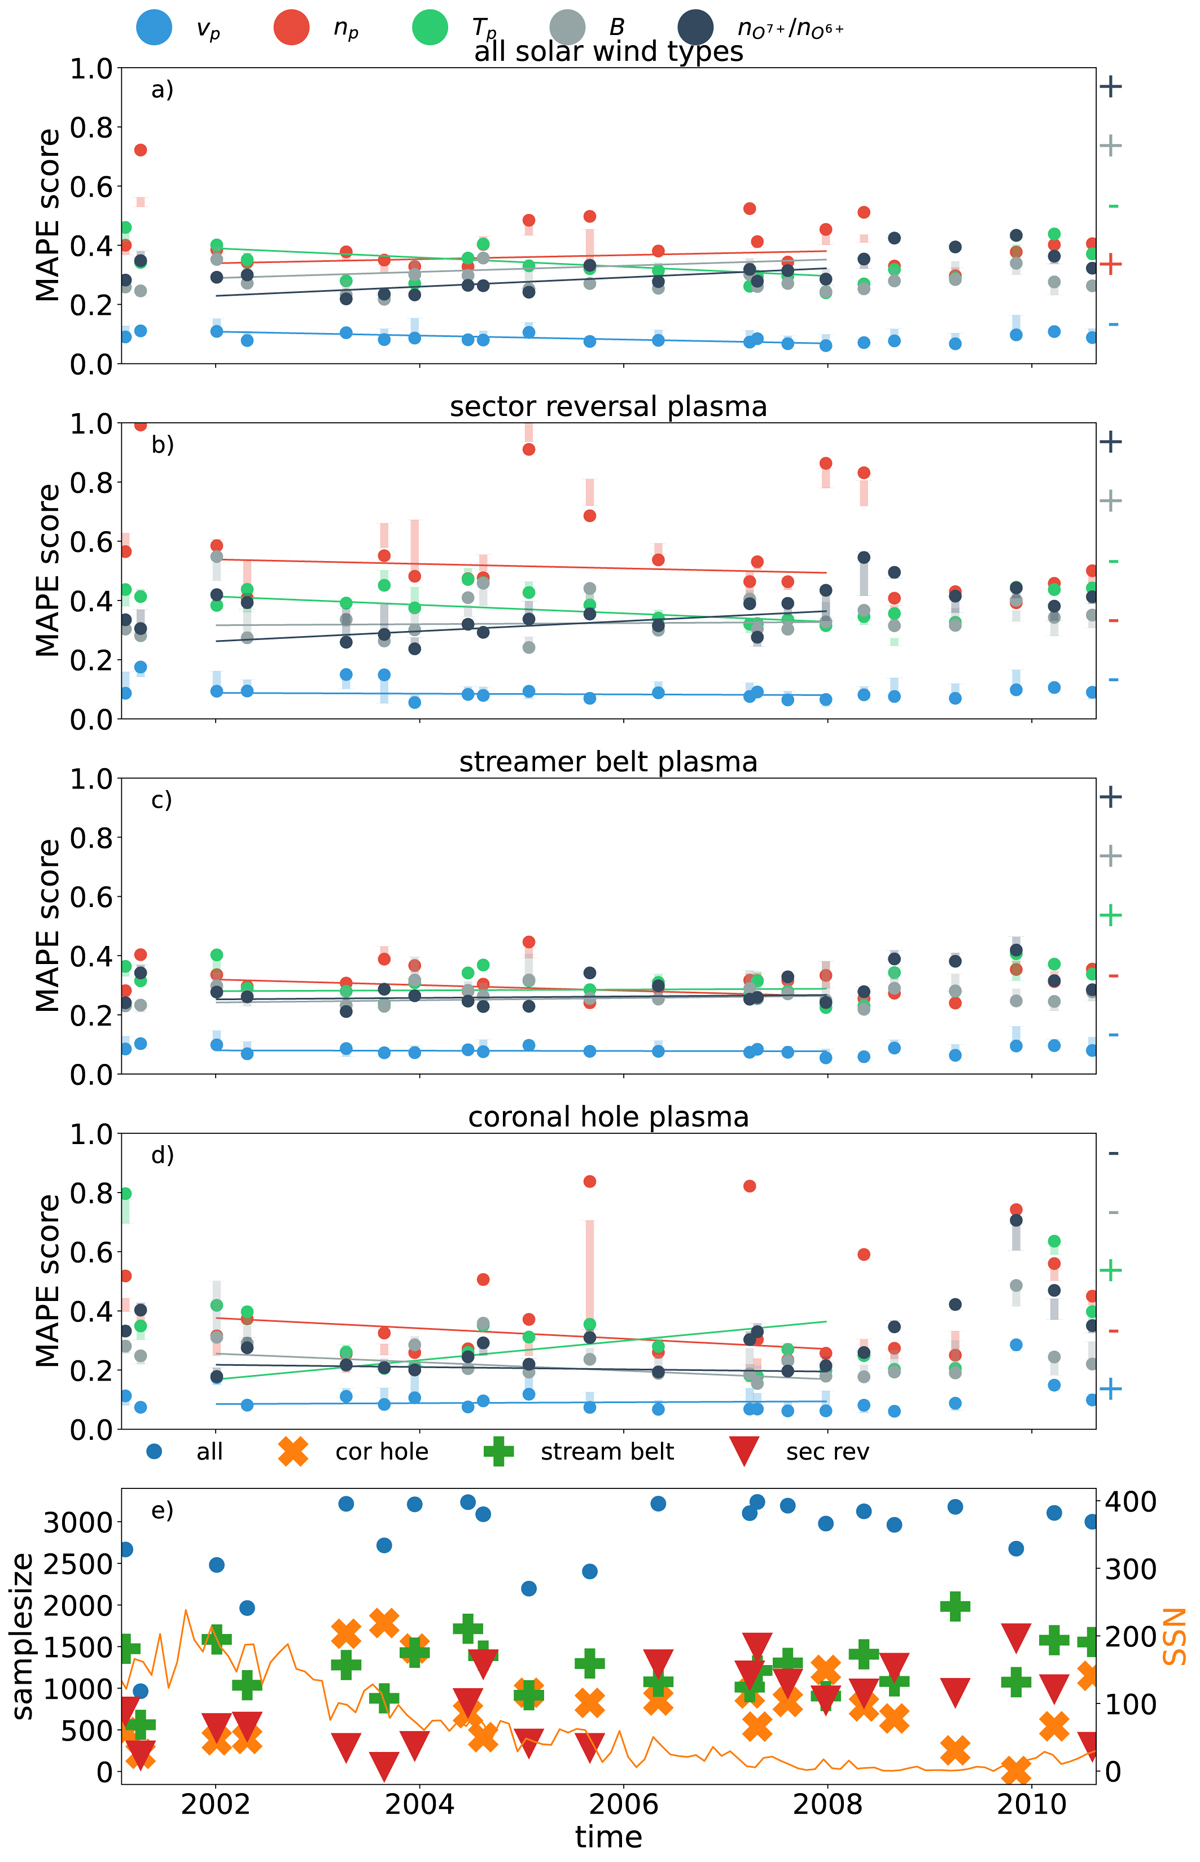
MAPE scores for each time period from the test data set for each reconstructed solar wind parameter over ten years and sorted by solar wind type. The top panel shows the respective MAPE scores on all (non-ICME) solar wind data from each test data time period. The three panels below show the MAPE scores separated by their Xu & Borovsky (2015) solar wind type (from top to bottom: sector reversal wind, streamer belt plasma, and coronal hole wind). The bottom panel gives the number of valid data points per test data time period and solar wind type. In addition, on the right y-axis, the bottom panel includes the monthly sun spot number as a reference (SILSO World Data Center 2001-2010). In the four top panels, simple linear fits to the scores of each reconstructed parameter (from 2002 to 2008) are shown as thin coloured lines. To the right of each of the four upper plots, plus and minus symbols in the colour of the respective reconstructed parameter indicate whether the slope of the corresponding line is positive (+) or negative (−).
Current usage metrics show cumulative count of Article Views (full-text article views including HTML views, PDF and ePub downloads, according to the available data) and Abstracts Views on Vision4Press platform.
Data correspond to usage on the plateform after 2015. The current usage metrics is available 48-96 hours after online publication and is updated daily on week days.
Initial download of the metrics may take a while.