Fig. 5.
Download original image
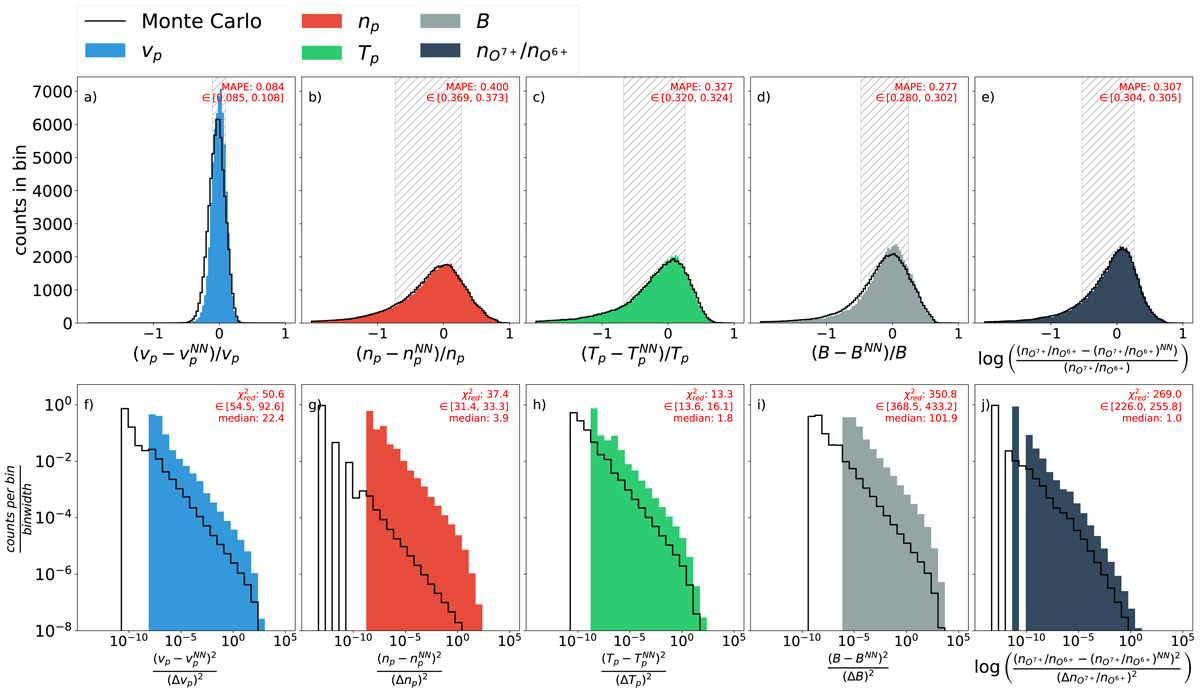
One-dimensional histograms of reconstruction errors ydiff and χ2 scores for each reconstructed solar wind parameter. In each panel, the x-axis is constrained to contain 100 bins from −2 to 1. Each of the top panels depicts the reconstruction accuracy of one of the five reconstructed solar wind parameters (a–e) based on the MAPE score, and the bottom panels (f–j) show normalised densities of the χ2 score for each determined parameter. Each column refers a different reconstructed parameter, from left to right: vp (a) and (f) in blue, np (b) and (g) in red, Tp (c) and (h) in green, B (d) and (i) in light grey, and nO^7+/nO^6+ (e) and (j) in dark grey. In each histogram, an area is marked with grey hatches that contains all data from the 15.9th to the 84.1th percentiles. The respective MAPE score and ![]() are indicated in insets in the top and bottom rows. For both, the respective confidence intervals derived from the Monte Carlo runs are included. An additional black histogram outline is included in each panel, which represents the variability of the Monte Carlo simulations based on randomised input data. In each panel, the x-axis contains 30 logarithmic bins. In the bottom row only, the y-axis is also logarithmic with a lower bound of 10−8, i.e., 0.00001% of the χ2 score density, and the histogram is normalised to the sum of the distribution. The inset also depicts the
are indicated in insets in the top and bottom rows. For both, the respective confidence intervals derived from the Monte Carlo runs are included. An additional black histogram outline is included in each panel, which represents the variability of the Monte Carlo simulations based on randomised input data. In each panel, the x-axis contains 30 logarithmic bins. In the bottom row only, the y-axis is also logarithmic with a lower bound of 10−8, i.e., 0.00001% of the χ2 score density, and the histogram is normalised to the sum of the distribution. The inset also depicts the ![]() score. In addition, the median of the individual χ2 scores is noted to show the spread of the distribution.
score. In addition, the median of the individual χ2 scores is noted to show the spread of the distribution.
Current usage metrics show cumulative count of Article Views (full-text article views including HTML views, PDF and ePub downloads, according to the available data) and Abstracts Views on Vision4Press platform.
Data correspond to usage on the plateform after 2015. The current usage metrics is available 48-96 hours after online publication and is updated daily on week days.
Initial download of the metrics may take a while.