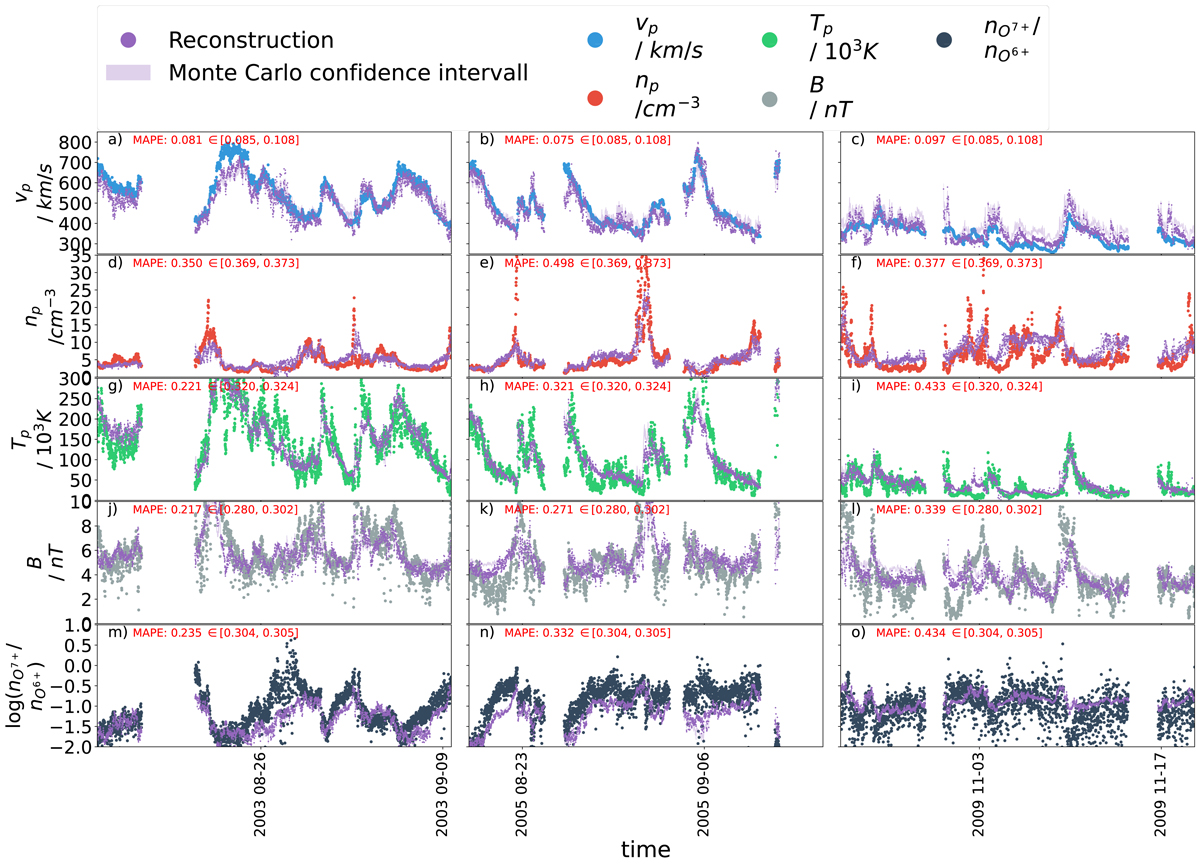
Fig. 4.
Download original image
Time series of reconstructed and measured solar wind parameters for three selected test data time periods with the average length of a Carrington rotation. The time periods were chosen, based on the MAPE score, to be representative examples of ‘good’, ‘intermediate’, and ‘poor’ performance, respectively. The time period to the left represents one of the most accurate reconstructions, the middle time period represents a reconstruction of average accuracy, and the right time period is one of the poorest reconstructions. For each Carrington rotation, the observed data are plotted in blue and the reconstructed data are plotted in purple. The uncertainty on the reconstruction is estimated with 100 Monte Carlo simulations. The 15.9th to the 84.1st percentiles of the Monte Carlo runs are plotted as purple-shaded areas. Each row depicts one solar wind parameter, from top to bottom: vp (a), (b), and (c) in blue, np (d), (e), and (f) in red, Tp (g), (h), and (i) in green, B (j), (k), and (l) in light grey, and nO^7+/nO^6+ (m), (n), and (o) in dark grey. The MAPE score for each part of the test data set is shown in red as an inset.
Current usage metrics show cumulative count of Article Views (full-text article views including HTML views, PDF and ePub downloads, according to the available data) and Abstracts Views on Vision4Press platform.
Data correspond to usage on the plateform after 2015. The current usage metrics is available 48-96 hours after online publication and is updated daily on week days.
Initial download of the metrics may take a while.