Open Access
Fig. 9.
Download original image
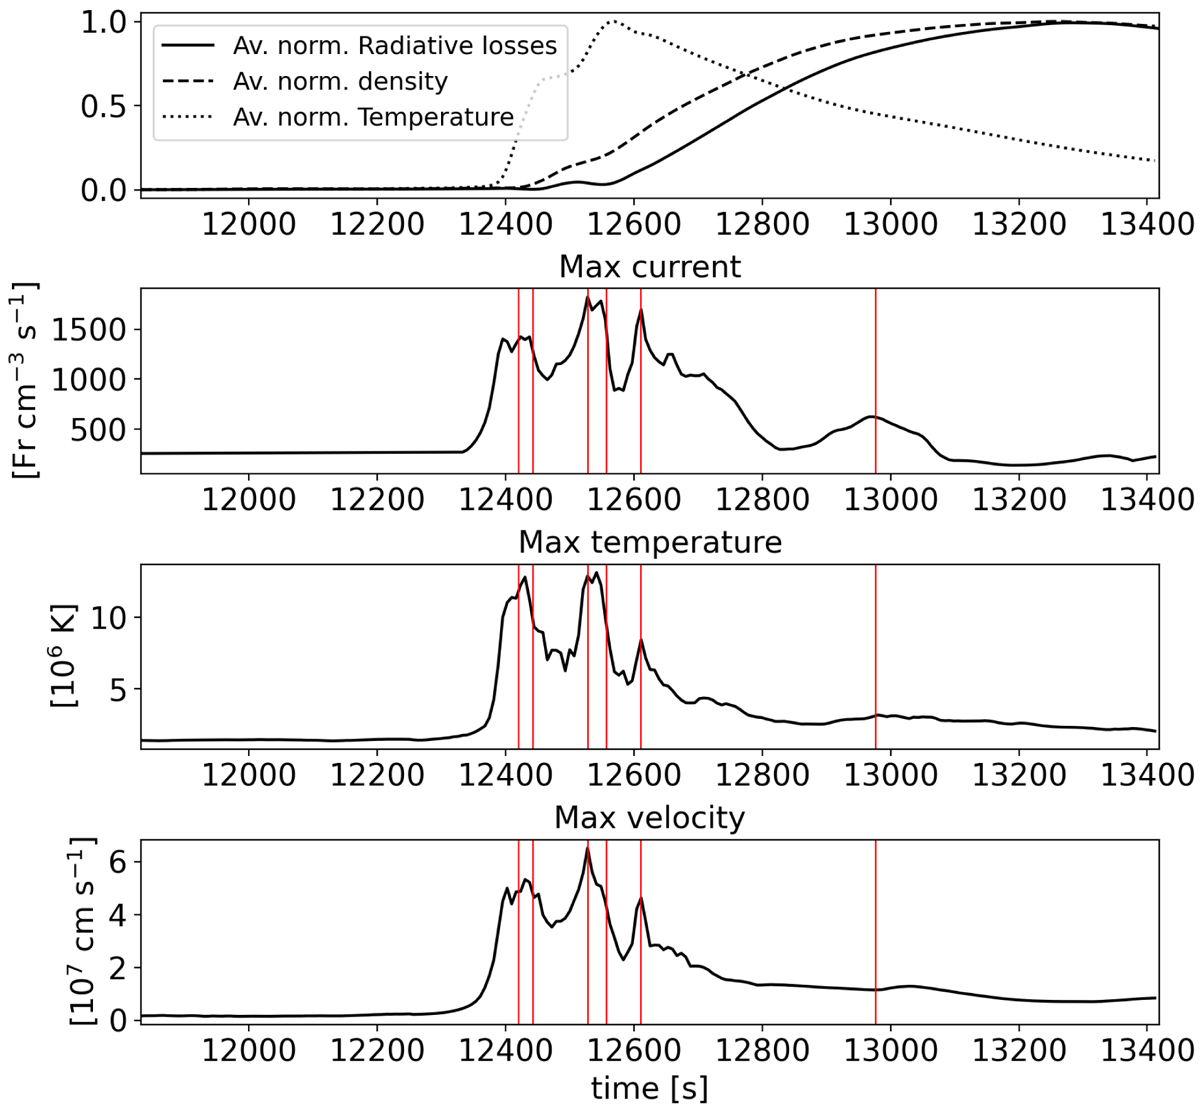
Global evolution of the MHD avalanche. From top to bottom: average normalized radiative losses, density and temperature in the corona, maximum current density, maximum temperature, and maximum velocity against time. The red vertical lines mark the times of large heating events.
Current usage metrics show cumulative count of Article Views (full-text article views including HTML views, PDF and ePub downloads, according to the available data) and Abstracts Views on Vision4Press platform.
Data correspond to usage on the plateform after 2015. The current usage metrics is available 48-96 hours after online publication and is updated daily on week days.
Initial download of the metrics may take a while.