Fig. 8.
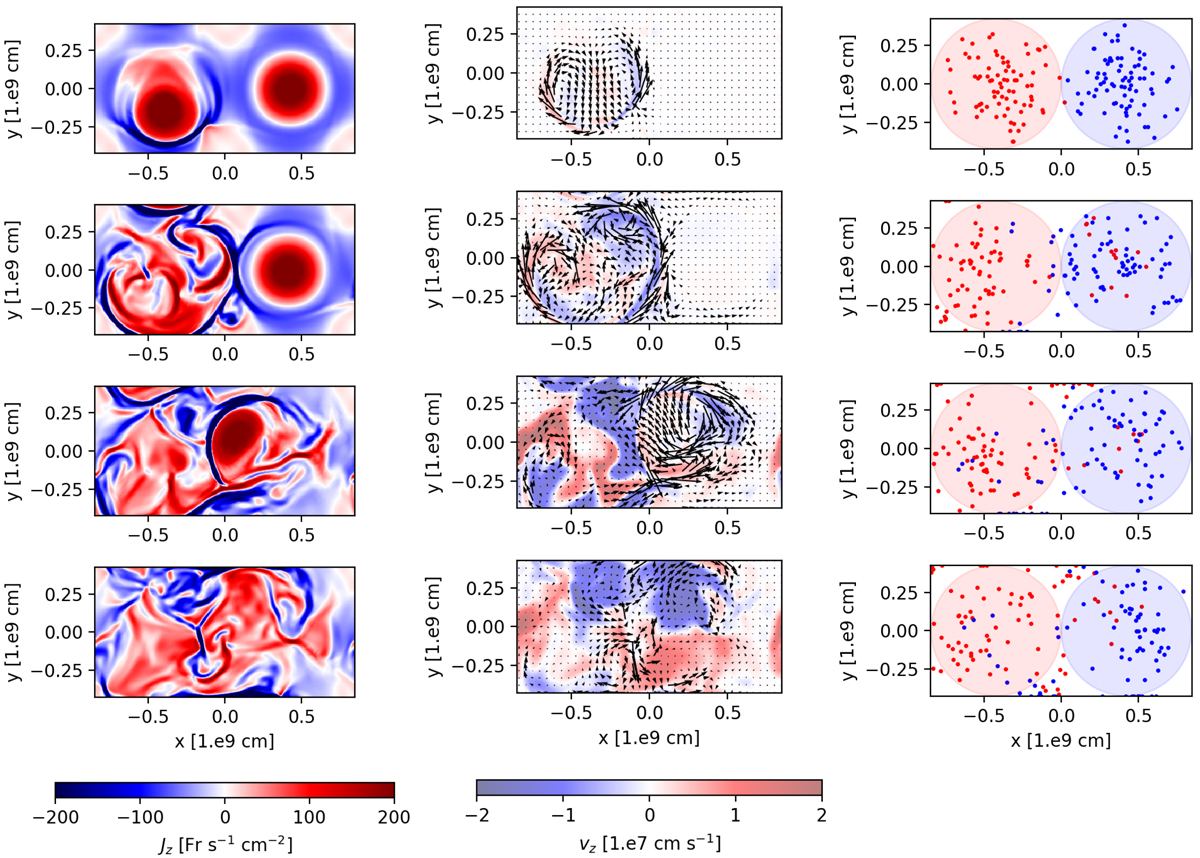
Download original image
Onset and evolution of the MHD avalanche. First column: horizontal cut of the current density across the mid-plane at times (from the top) t = 12 400 s (onset of first kink instability), t = 12 500 s, t = 12 550 s (second strand’s disruption), and t = 12 600 s. Second column: horizontal cut of the velocity across the mid-plane at the same four times. The arrows show the orientation of the velocity field. The colour maps evaluate the intensity of the vertical component of the velocity field. Third column: terminal locations (z = L) of the sample field lines at the same four times. The red field lines (spots) depart from the z = −L footpoint on the left (red shaded region), and the blue field lines depart from the right (blue shaded region). Initially, the red and blue field lines are randomly distributed inside the blue and red circles, respectively. Subsequent starting locations at the lower boundary points were determined at later times by tracking their locations in response to the photospheric motions.
Current usage metrics show cumulative count of Article Views (full-text article views including HTML views, PDF and ePub downloads, according to the available data) and Abstracts Views on Vision4Press platform.
Data correspond to usage on the plateform after 2015. The current usage metrics is available 48-96 hours after online publication and is updated daily on week days.
Initial download of the metrics may take a while.