Open Access
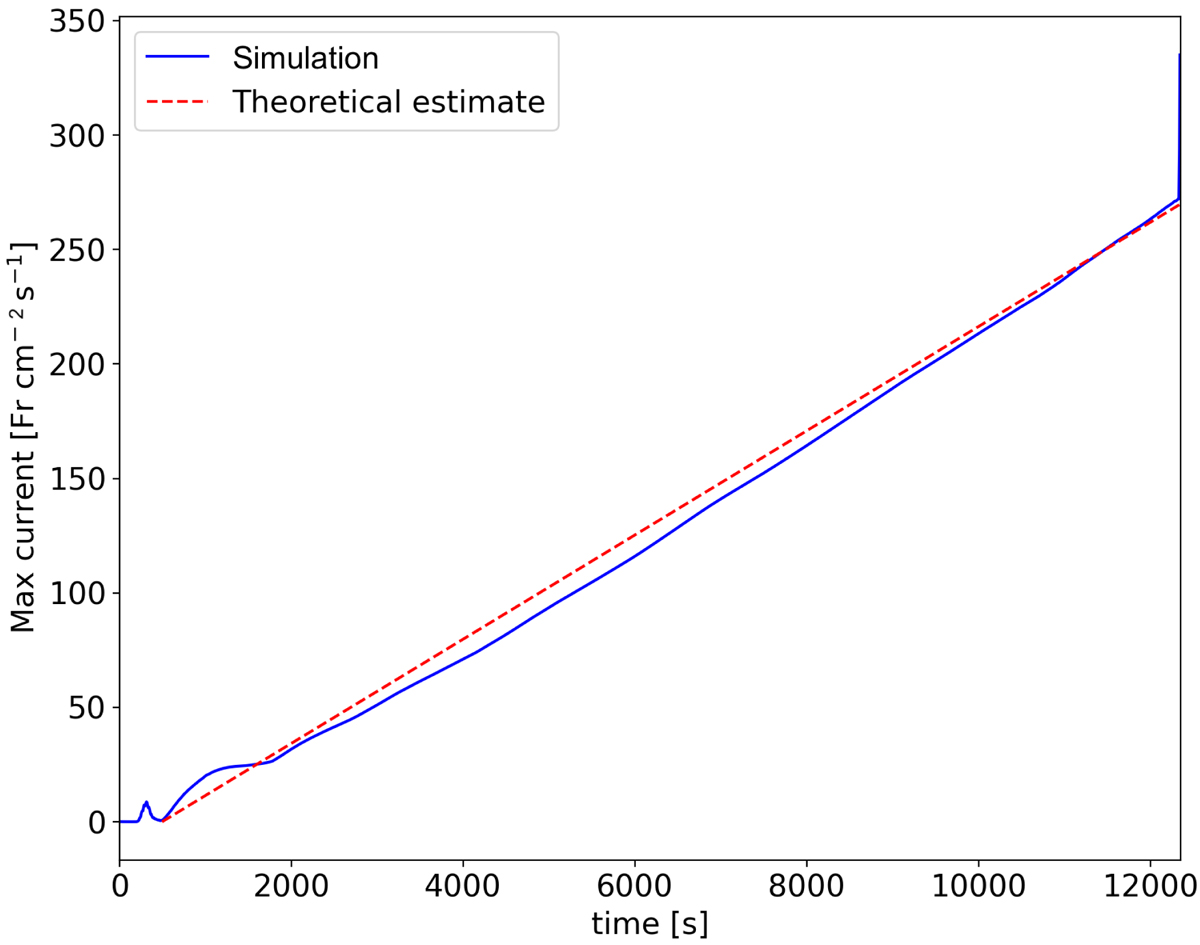
Fig. 6.
Download original image
Evolution of the maximum current density. The solid, blue curve represents the maximum current intensity, before the onset of the instability, as a function of time. In dashed red is the theoretical estimate based on the model described in Sect. 3.
Current usage metrics show cumulative count of Article Views (full-text article views including HTML views, PDF and ePub downloads, according to the available data) and Abstracts Views on Vision4Press platform.
Data correspond to usage on the plateform after 2015. The current usage metrics is available 48-96 hours after online publication and is updated daily on week days.
Initial download of the metrics may take a while.