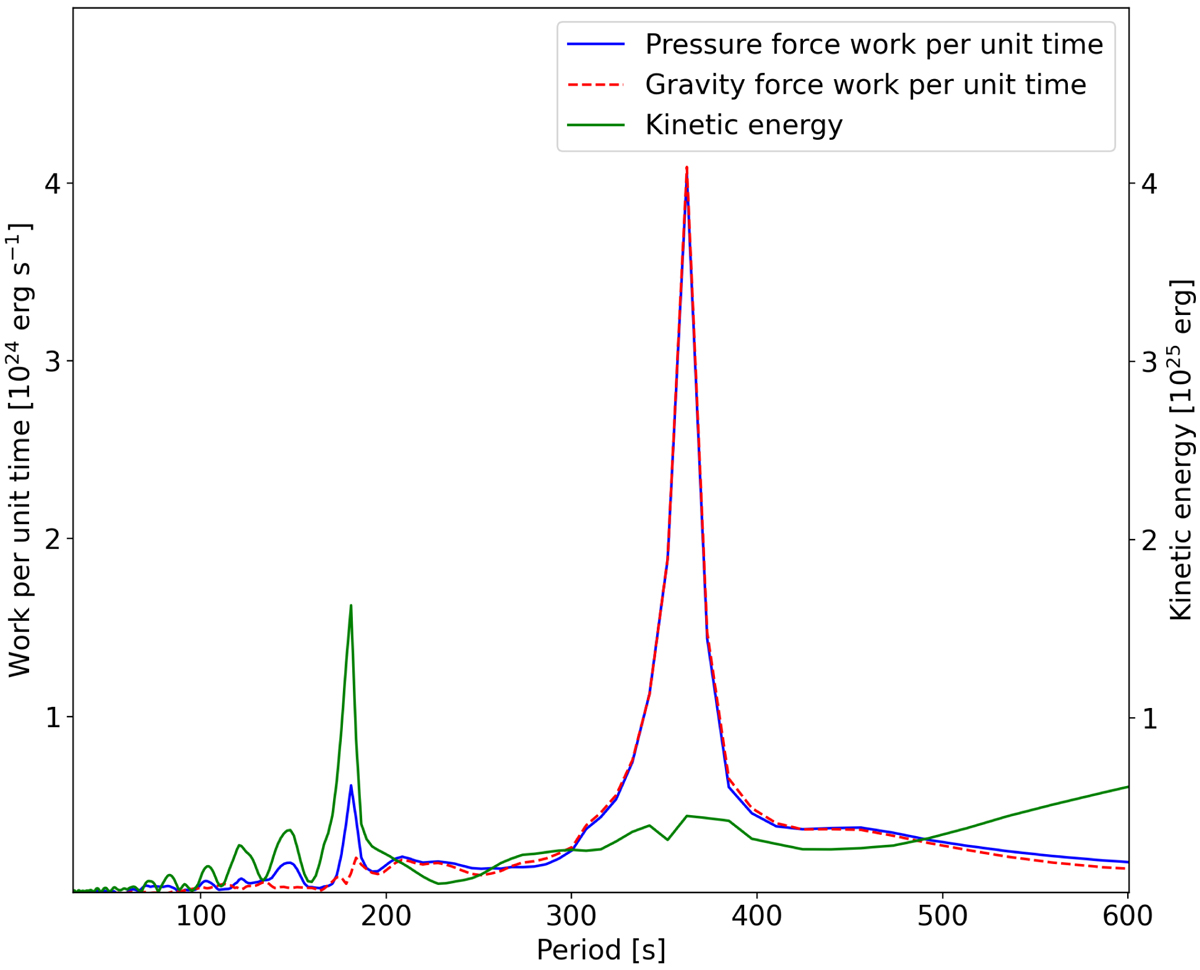
Fig. 3.
Download original image
Fourier transform of pressure work, gravity work, and kinetic energy rates. The blue curve indicates the Fourier transform of the work done by pressure gradients per unit time, before the onset of the instability. The red curve represents the Fourier transform of the work done by gravity force per unit time, before the onset of the instability. Both curves show a peak around T ≈ 365 s (identified by eye). The green curve depicts the Fourier transform of the kinetic energy before the onset of the instability. It shows a peak around 180 s.
Current usage metrics show cumulative count of Article Views (full-text article views including HTML views, PDF and ePub downloads, according to the available data) and Abstracts Views on Vision4Press platform.
Data correspond to usage on the plateform after 2015. The current usage metrics is available 48-96 hours after online publication and is updated daily on week days.
Initial download of the metrics may take a while.