Fig. 2.
Download original image
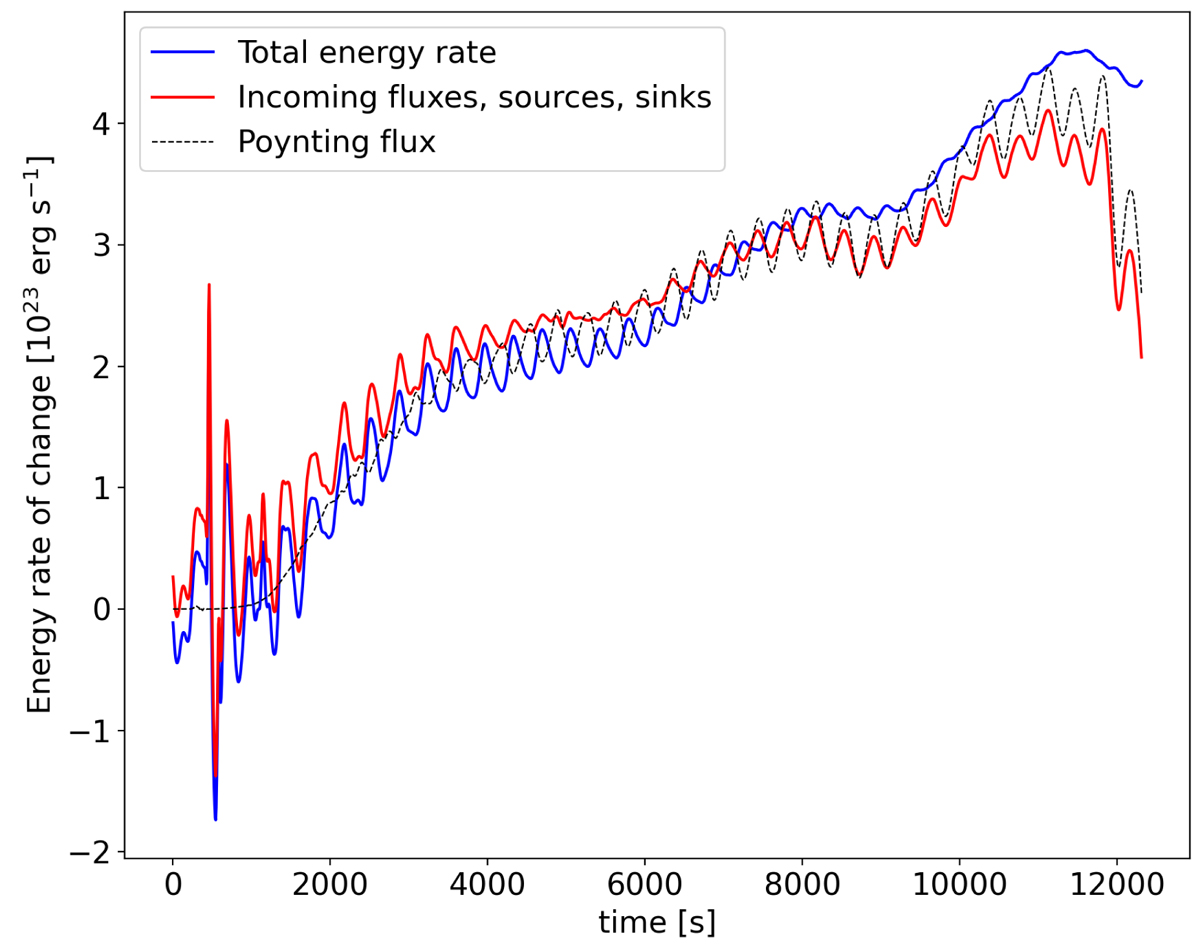
Evolution of the rate of change of the total energy, incoming fluxes, sources, and sinks for the reference simulation. The blue curve indicates the change in total energy over time, given by the sum of internal, kinetic, magnetic, and gravitational energies of the system, plotted as functions of time, before the onset of the instability. The red curve represents the sum of the total fluxes, energy sources, and sinks as a function of time before the onset of the instability. The closeness of the blue and red curves demonstrates the approximate energy conservation in the domain. The dashed black curve depicts the Poynting flux, which is the dominant flux and adds to the magnetic energy.
Current usage metrics show cumulative count of Article Views (full-text article views including HTML views, PDF and ePub downloads, according to the available data) and Abstracts Views on Vision4Press platform.
Data correspond to usage on the plateform after 2015. The current usage metrics is available 48-96 hours after online publication and is updated daily on week days.
Initial download of the metrics may take a while.