Fig. 1.
Download original image
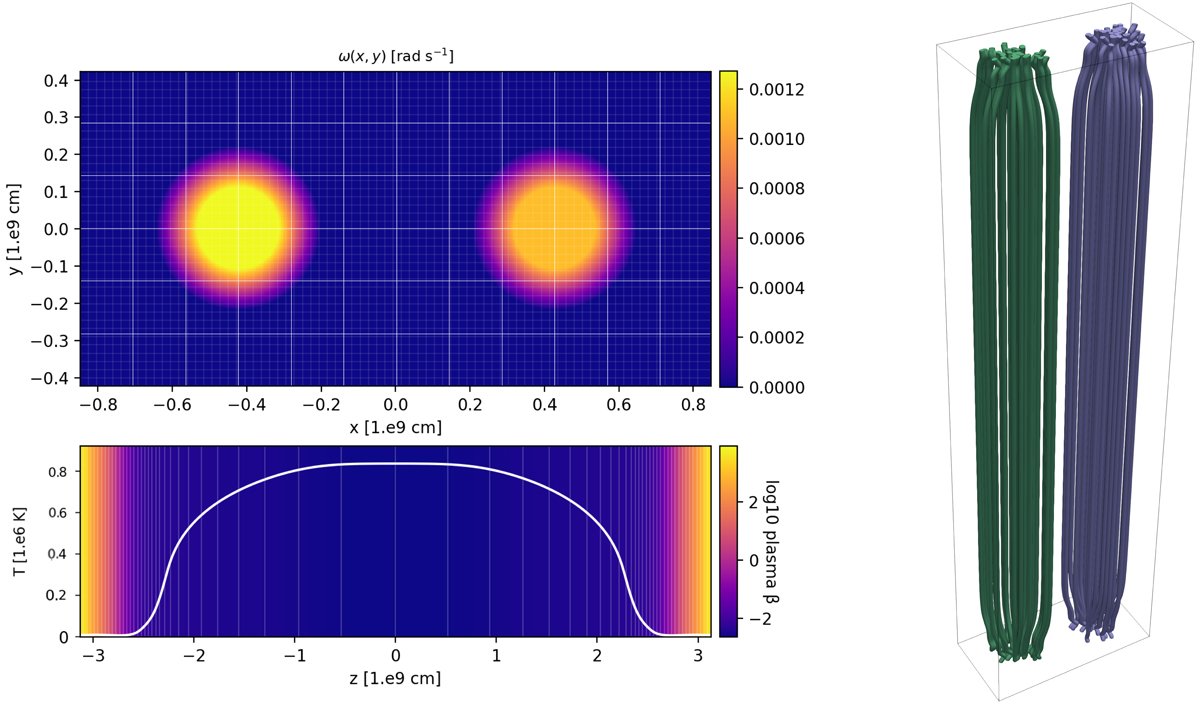
Initial conditions used in the numerical simulation. Upper-left panel: map of the angular velocity at the bottom of the box. The colour scale emphasizes higher angular velocity. The uniform grid is marked. The two rotating regions have the same radius Rmax. The region on the left has a higher angular velocity (vmax.,left = 1.1 × vmax.,right). Lower-left panel: map of average plasma β as a function of z at t = 0 s. The solid curve shows the initial temperature along the z axis. Right panel: three-dimensional rendering of the initial magnetic field configuration in the box around the two flux tubes. The green field lines are twisted more quickly than the purple ones.
Current usage metrics show cumulative count of Article Views (full-text article views including HTML views, PDF and ePub downloads, according to the available data) and Abstracts Views on Vision4Press platform.
Data correspond to usage on the plateform after 2015. The current usage metrics is available 48-96 hours after online publication and is updated daily on week days.
Initial download of the metrics may take a while.