Fig. 9.
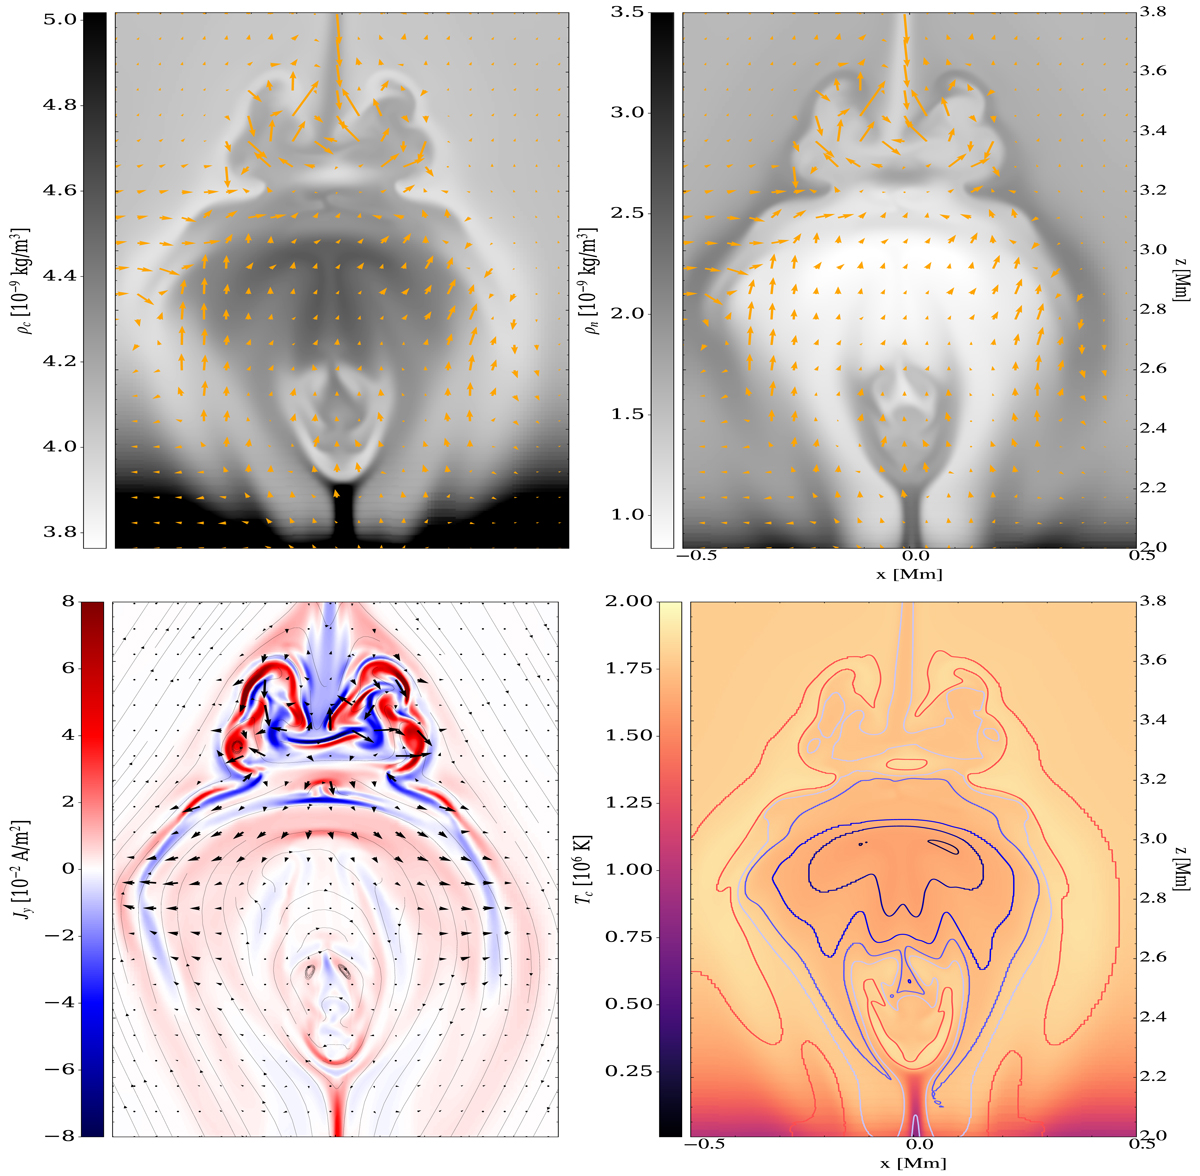
Download original image
Two-fluid coronal-reconnection downflows impacting the chromosphere. We provide snapshots of charged density (top left), neutral density (top right), out-of-plane current density (bottom left), and charged temperature (bottom right) for the simulation zrec = 4.5 Mm, with 2flα at t = 591.5 s; the last time shown is in the right column at the bottom of Fig. 3. In the panels of neutral and charged densities (top panels), the orange arrows show the velocities of neutral and charged fluid, respectively. We overplot the magnetic field lines and the decoupling velocities over the current density map (bottom-left panel) and isocontours of the temperature decoupling (Tc − Tn) in the range −1.8 × 10⁶ K and 1.8 × 10⁶ K over the charged temperature image (bottom-right panel).
Current usage metrics show cumulative count of Article Views (full-text article views including HTML views, PDF and ePub downloads, according to the available data) and Abstracts Views on Vision4Press platform.
Data correspond to usage on the plateform after 2015. The current usage metrics is available 48-96 hours after online publication and is updated daily on week days.
Initial download of the metrics may take a while.