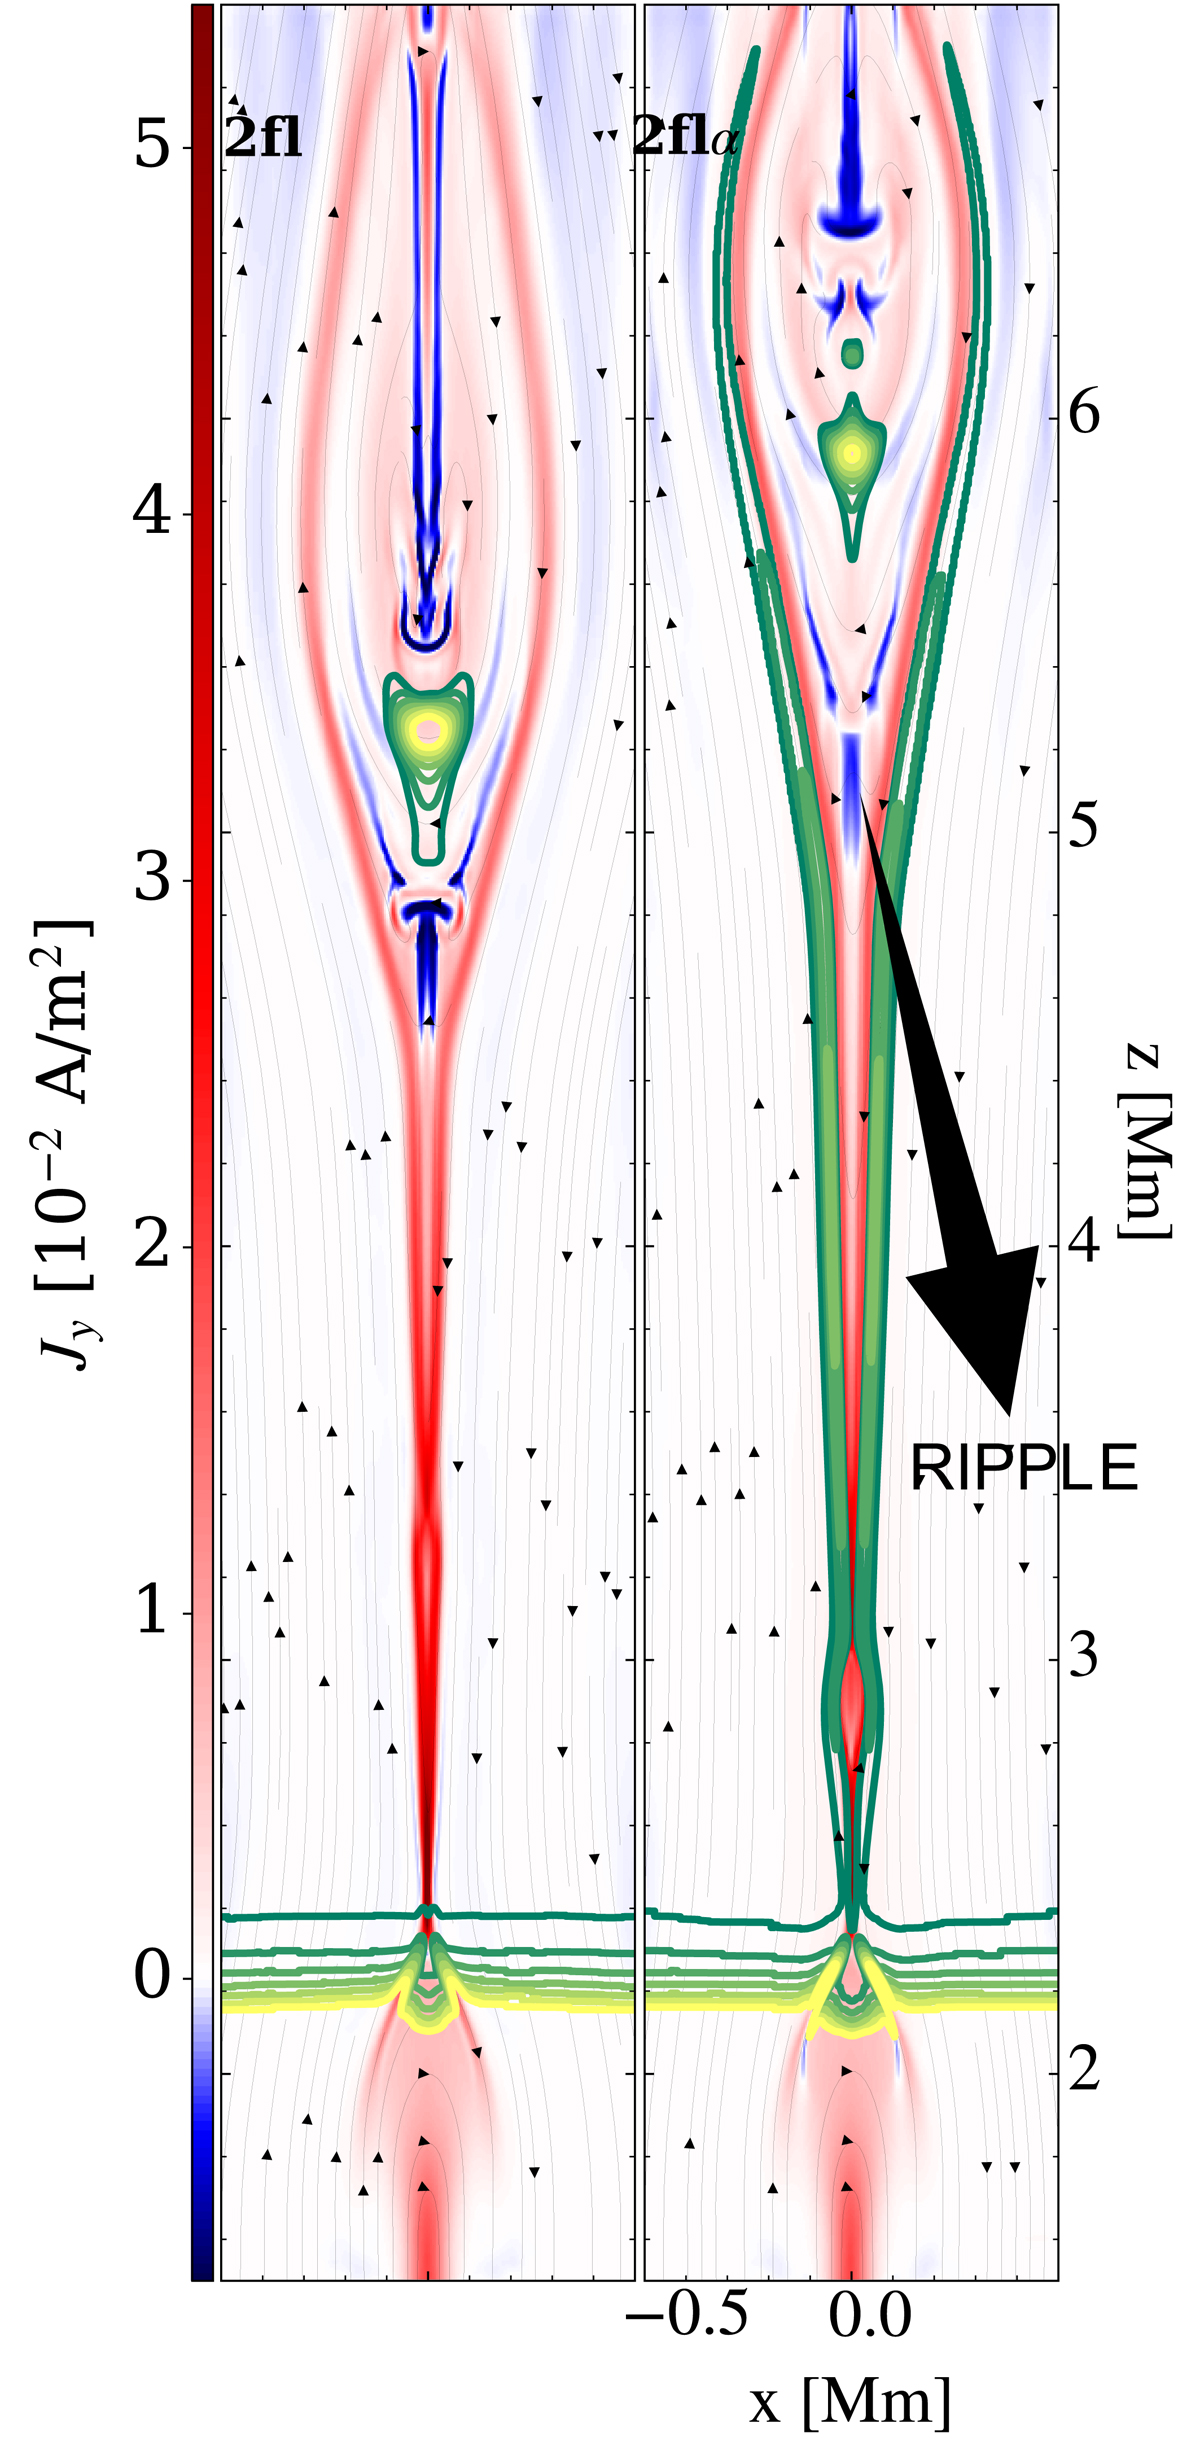
Fig. 4.
Download original image
Comparison between the out-of-plane current density. For two-fluid models: 2fl (left) and 2flα (right) at t = 622.6 s. Black lines with arrows are magnetic field lines. Yellow-to-green colored contours relate to the density variation. The ripple in the magnetic field, associated with the reversal in the Bz sign, located at z ≈ 5 Mm, is indicated in the figure.
Current usage metrics show cumulative count of Article Views (full-text article views including HTML views, PDF and ePub downloads, according to the available data) and Abstracts Views on Vision4Press platform.
Data correspond to usage on the plateform after 2015. The current usage metrics is available 48-96 hours after online publication and is updated daily on week days.
Initial download of the metrics may take a while.