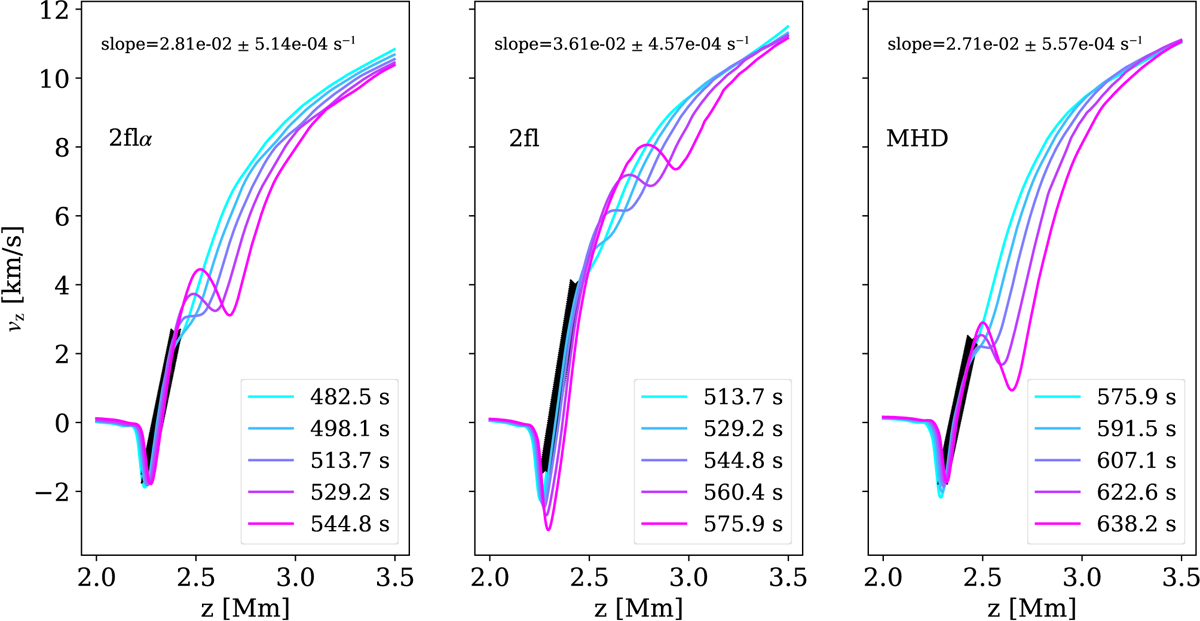
Fig. 11.
Download original image
Vertical profiles of the vertical velocity when the plasmoids form for zrec = 2 Mm. Shown for five moments in time in the late stage of the simulations, for the three models: 2flα (left panel), 2fl (middle panel), and MHD (right panel). For the two-fluid models (left and middle panels), we show the velocity of charges. The linear fit of the velocity profile around the reconnection point (where the velocity changes sign) is shown by a black line and the value of the slope is indicated at the top of each panel.
Current usage metrics show cumulative count of Article Views (full-text article views including HTML views, PDF and ePub downloads, according to the available data) and Abstracts Views on Vision4Press platform.
Data correspond to usage on the plateform after 2015. The current usage metrics is available 48-96 hours after online publication and is updated daily on week days.
Initial download of the metrics may take a while.