Open Access
Fig. 1.
Download original image
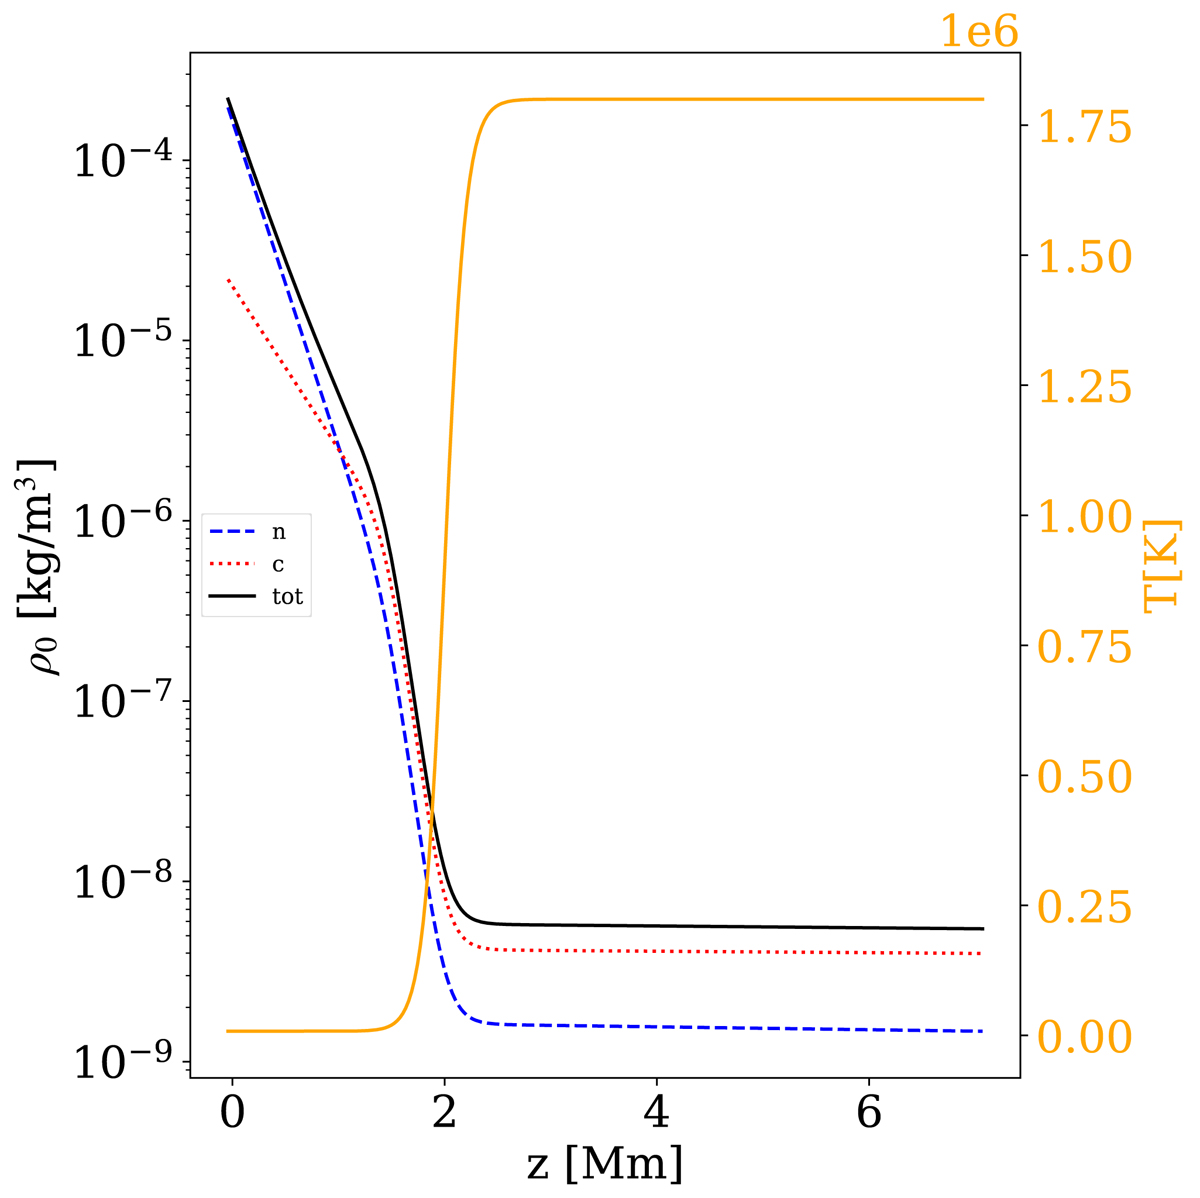
Initial profiles as a function of height. For the densities, neutrals (dashed blue line), charges (dotted red line), and the total (solid black line) are on the left axis. The temperature (solid orange line) is on the right axis.
Current usage metrics show cumulative count of Article Views (full-text article views including HTML views, PDF and ePub downloads, according to the available data) and Abstracts Views on Vision4Press platform.
Data correspond to usage on the plateform after 2015. The current usage metrics is available 48-96 hours after online publication and is updated daily on week days.
Initial download of the metrics may take a while.