Fig. 9
Download original image
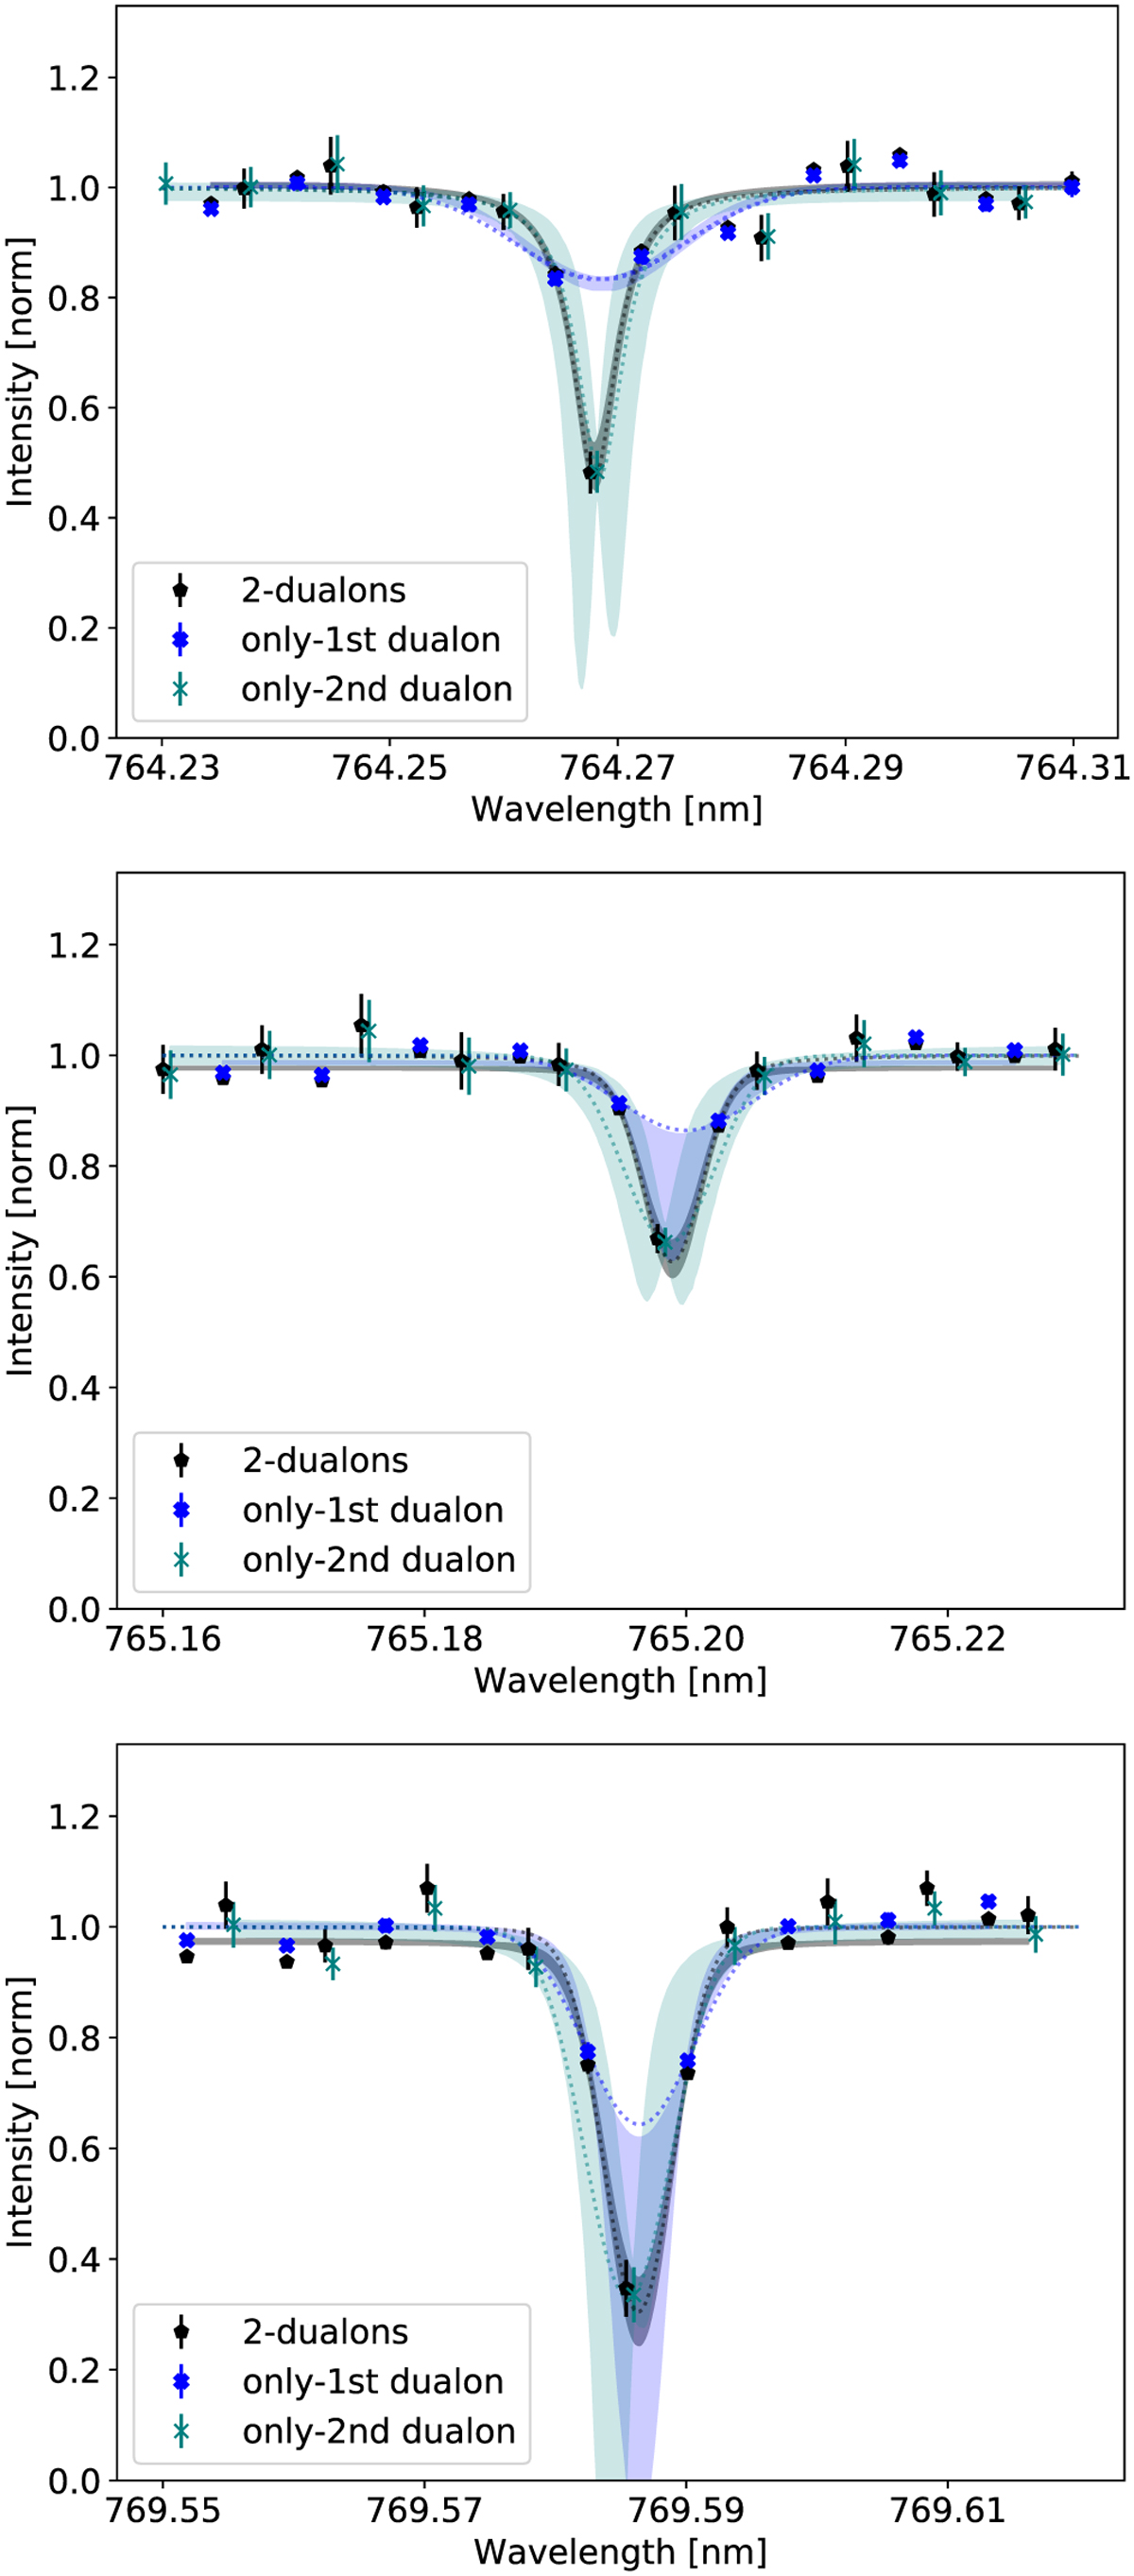
Zoomed-in regions within the O2A-band of three datasets: Both dualons (black), dualon 1 (blue), and dualon 2 (green). Each dotted line is isolated and fitted with a Voigt model. The shaded area is the uncertainty of the fit. The black, blue, and green transparent shading correspond to the fit uncertainties for both dualons, only dualon 1, and only dualon 2, respectively. The FWHM results are reported in Table 2.
Current usage metrics show cumulative count of Article Views (full-text article views including HTML views, PDF and ePub downloads, according to the available data) and Abstracts Views on Vision4Press platform.
Data correspond to usage on the plateform after 2015. The current usage metrics is available 48-96 hours after online publication and is updated daily on week days.
Initial download of the metrics may take a while.