Fig. 8
Download original image
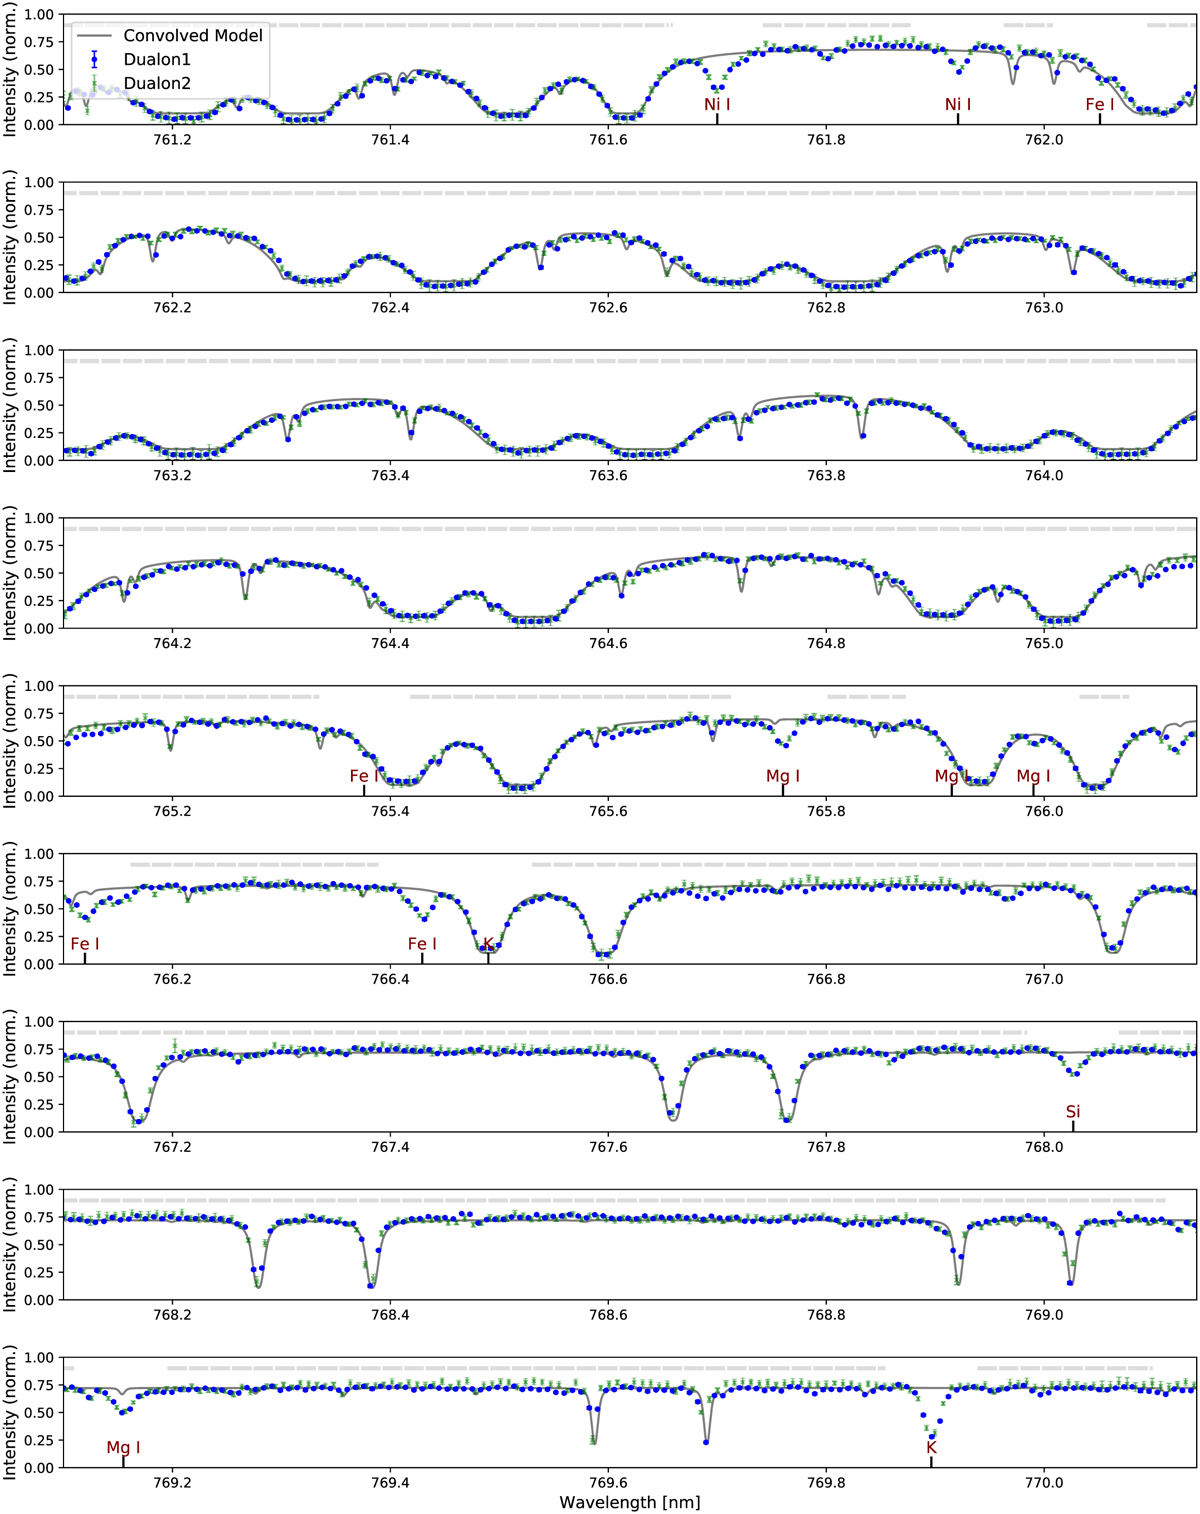
Reduced data points from the first and second arm of the FPI unit. The spectral profiles from dualon 1 (blue) and dualon 2 (green) are fitted with model of the oxygen A-band, where the central wavelength lies within the window 760–770 nm. The nonfitted features are marked as the atomic absorption lines from the solar spectrum.
Current usage metrics show cumulative count of Article Views (full-text article views including HTML views, PDF and ePub downloads, according to the available data) and Abstracts Views on Vision4Press platform.
Data correspond to usage on the plateform after 2015. The current usage metrics is available 48-96 hours after online publication and is updated daily on week days.
Initial download of the metrics may take a while.