Open Access
Fig. 7
Download original image
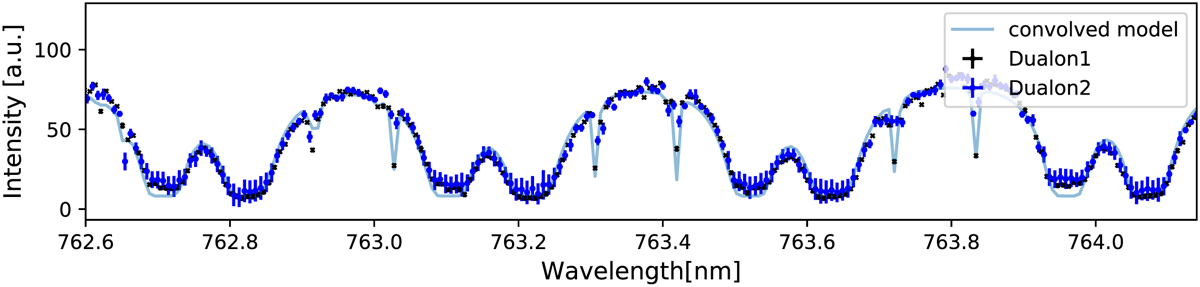
Reduced data with the dualon profile removed. The black data points are from dualon 1 and the blue points are from dualon 2. The blue error bars are larger than the black ones, due to the relative intensity observed from each arm. The convolved model of the oxygen A-band is shown as a light blue solid line.
Current usage metrics show cumulative count of Article Views (full-text article views including HTML views, PDF and ePub downloads, according to the available data) and Abstracts Views on Vision4Press platform.
Data correspond to usage on the plateform after 2015. The current usage metrics is available 48-96 hours after online publication and is updated daily on week days.
Initial download of the metrics may take a while.