Fig. 6
Download original image
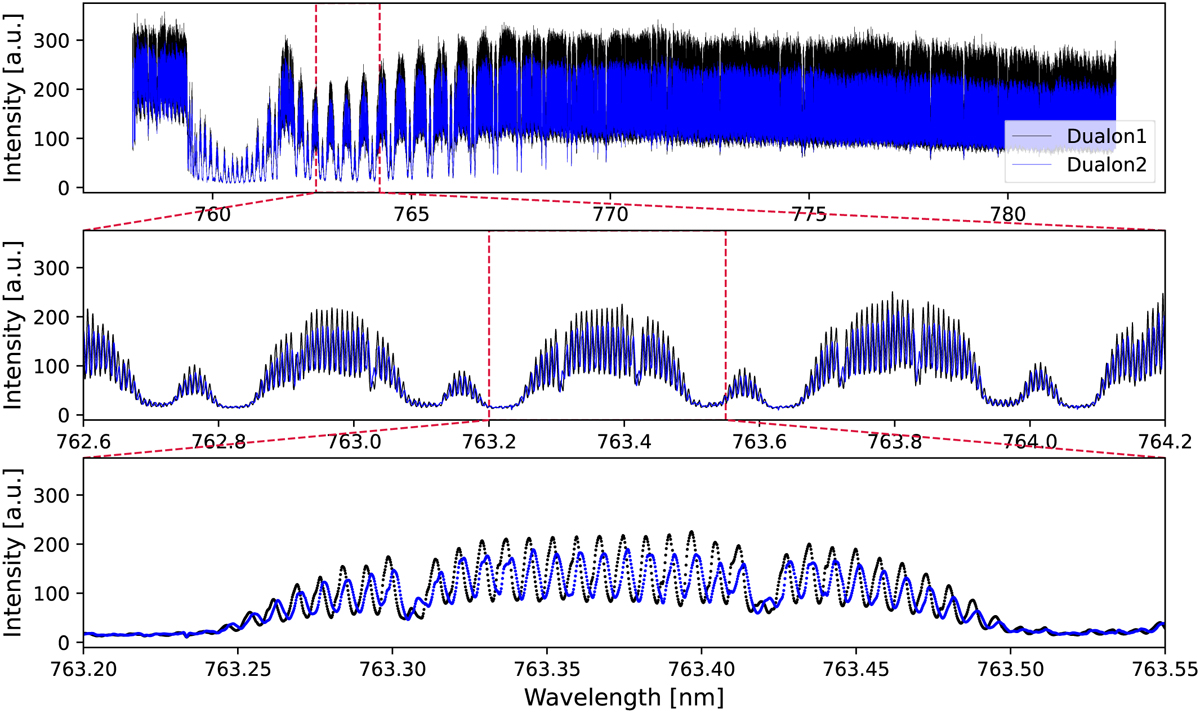
Observed spectrum of oxygen A-band embedded on the instrumental profiles. Top: oxygen A-band observation using two dualons in the arrays. Dualonl data are displayed in black and dualon2 in blue. Middle: zoom-in on the region indicated in the top panel. The features of the chained spectrum and the absorption feature are shown on top of the instrumental profiles. The signal of the dualon2 is scaled up by a factor of 1.5. Bottom: zoom-in on the region indicated in the middle panel showing the shift between the two dualons.
Current usage metrics show cumulative count of Article Views (full-text article views including HTML views, PDF and ePub downloads, according to the available data) and Abstracts Views on Vision4Press platform.
Data correspond to usage on the plateform after 2015. The current usage metrics is available 48-96 hours after online publication and is updated daily on week days.
Initial download of the metrics may take a while.