Fig. 10
Download original image
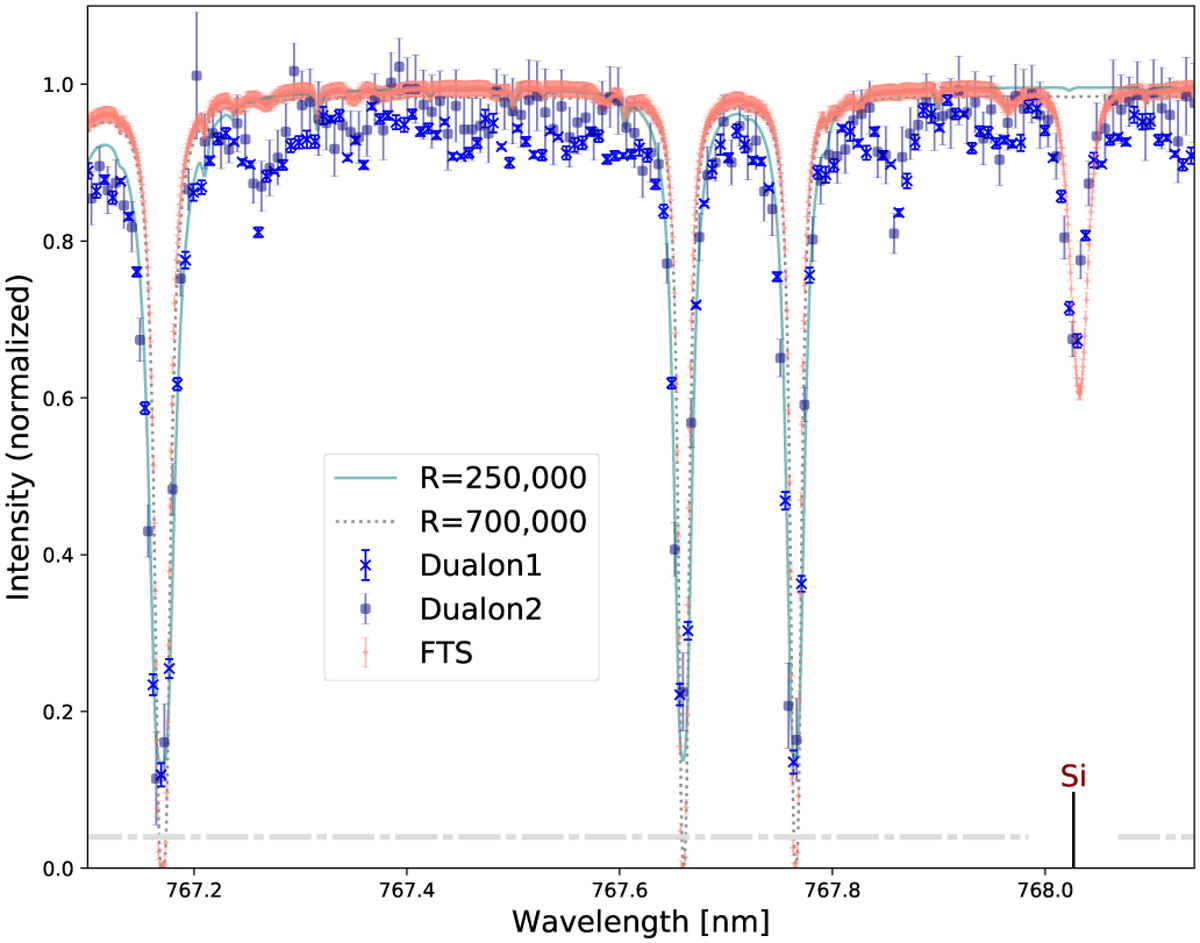
Comparison of a zoomed region at 767 nm detected with multiple instruments: two-arm FPI array (blue) with R = 250 000, Fourier Transform Spectrograph (FTS) at Kitt Peak (red) with R = 700 000. A fitted model for the FTS data is represented by the grey dotted line, while the light blue solid line is fitted to the two-dualon data.
Current usage metrics show cumulative count of Article Views (full-text article views including HTML views, PDF and ePub downloads, according to the available data) and Abstracts Views on Vision4Press platform.
Data correspond to usage on the plateform after 2015. The current usage metrics is available 48-96 hours after online publication and is updated daily on week days.
Initial download of the metrics may take a while.