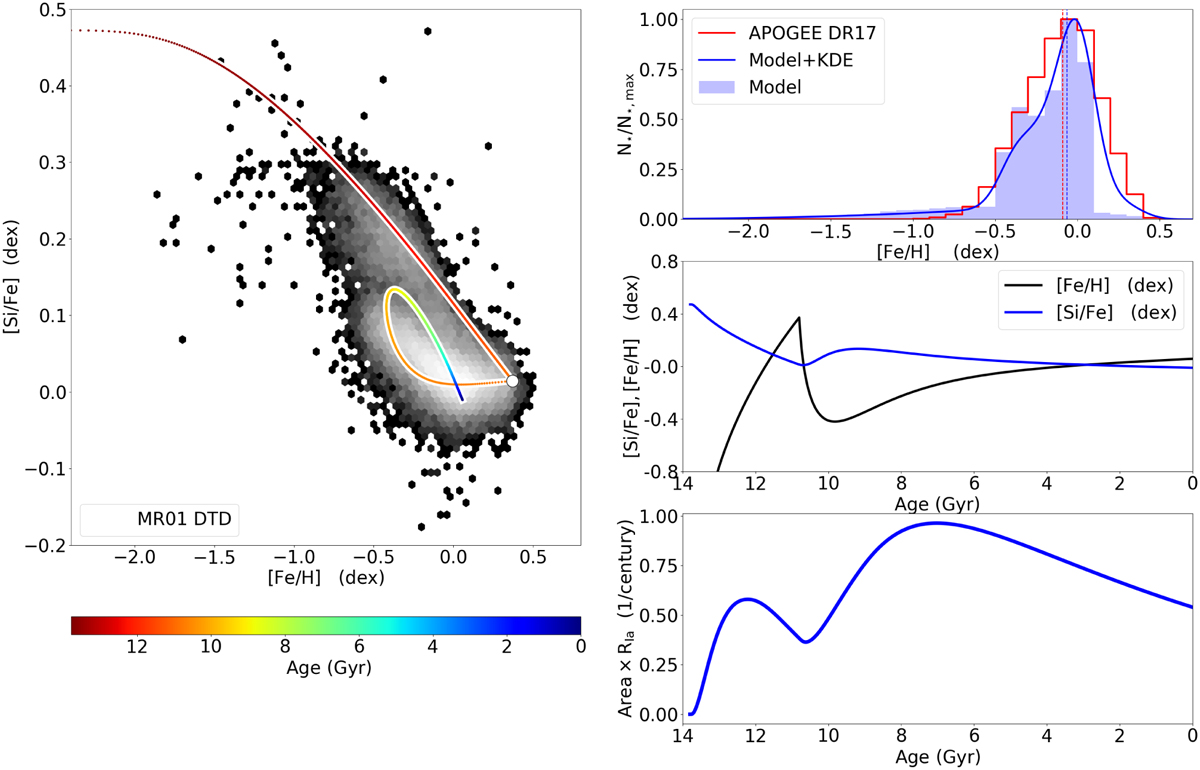
Fig. 8
Download original image
Predictions of the two-infall model assuming the MR01 DTD. Left panel: comparison of the [Si/Fe] versus [Fe/H] predicted by our two-infall model in the solar neighbourhood (see model details in Sect. 4) with the observational data of APOGEE DR17 (Abdurro’uf et al. 2022) in the Galactic region between 7.2 and 9.2 kpc. The colour coding throughout the model track stands for the ages of the SSPs formed during the Galactic disc evolution. The white circle represents the [Si/Fe] versus [Fe/H] value at the beginning of the second infall (tG – t2 = 10.8 Gyr). Upper-right panel: MDF expected from the two-infall model shown in Fig. 8 (blue histogram) compared to the MDF of the APOGEE DR17 sample (red empty histogram). The vertical lines indicate the median values of each distribution. Middle-right panel: age–metallicity (black line) and [Si/Fe] versus age (blue line) relations predicted by the same model as the upper panel. Lower-right panel: Temporal evolution of the Type Ia SN rate for the whole Galactic disc is indicated with the blue line.
Current usage metrics show cumulative count of Article Views (full-text article views including HTML views, PDF and ePub downloads, according to the available data) and Abstracts Views on Vision4Press platform.
Data correspond to usage on the plateform after 2015. The current usage metrics is available 48-96 hours after online publication and is updated daily on week days.
Initial download of the metrics may take a while.