Fig. 3
Download original image
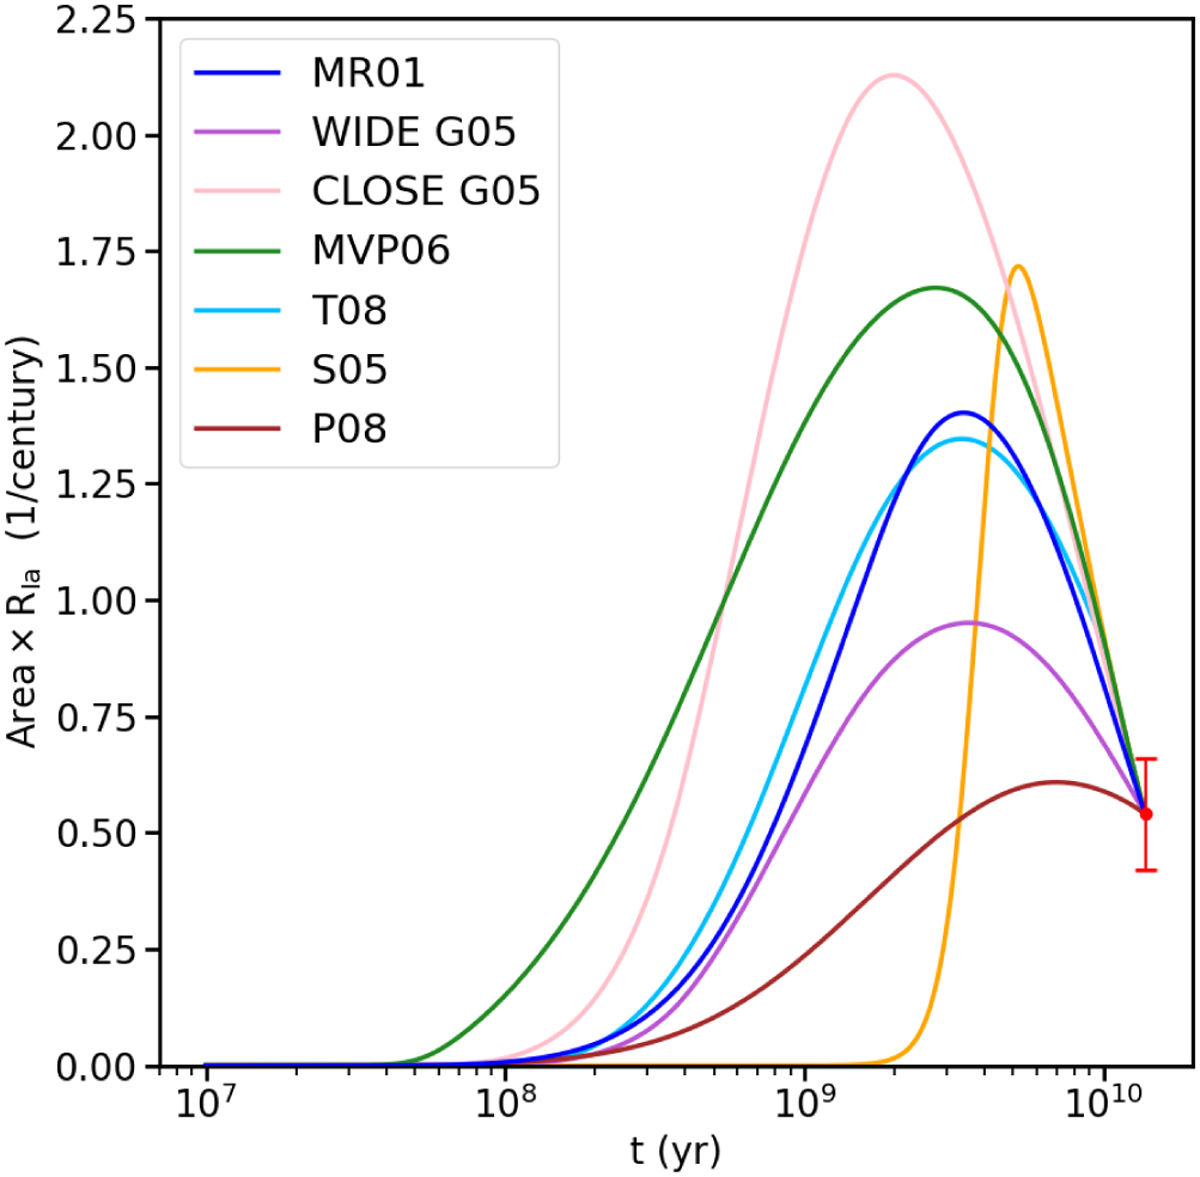
Predicted Type Ia SN rates for the different DTDs considered in this work (see Fig. 1) assuming the one-infall model introduced in Sect. 3.2. The area in the vertical axis refers to that of the Galactic disc region (3 kpc < R < 20 kpc). The rates are expressed in SN events per century and normalized (through the CIa) to reproduce the present time Type Ia SN rate in the Milky Way (Li et al. 2011, filled red circle and error bar).
Current usage metrics show cumulative count of Article Views (full-text article views including HTML views, PDF and ePub downloads, according to the available data) and Abstracts Views on Vision4Press platform.
Data correspond to usage on the plateform after 2015. The current usage metrics is available 48-96 hours after online publication and is updated daily on week days.
Initial download of the metrics may take a while.