Fig. A.3
Download original image
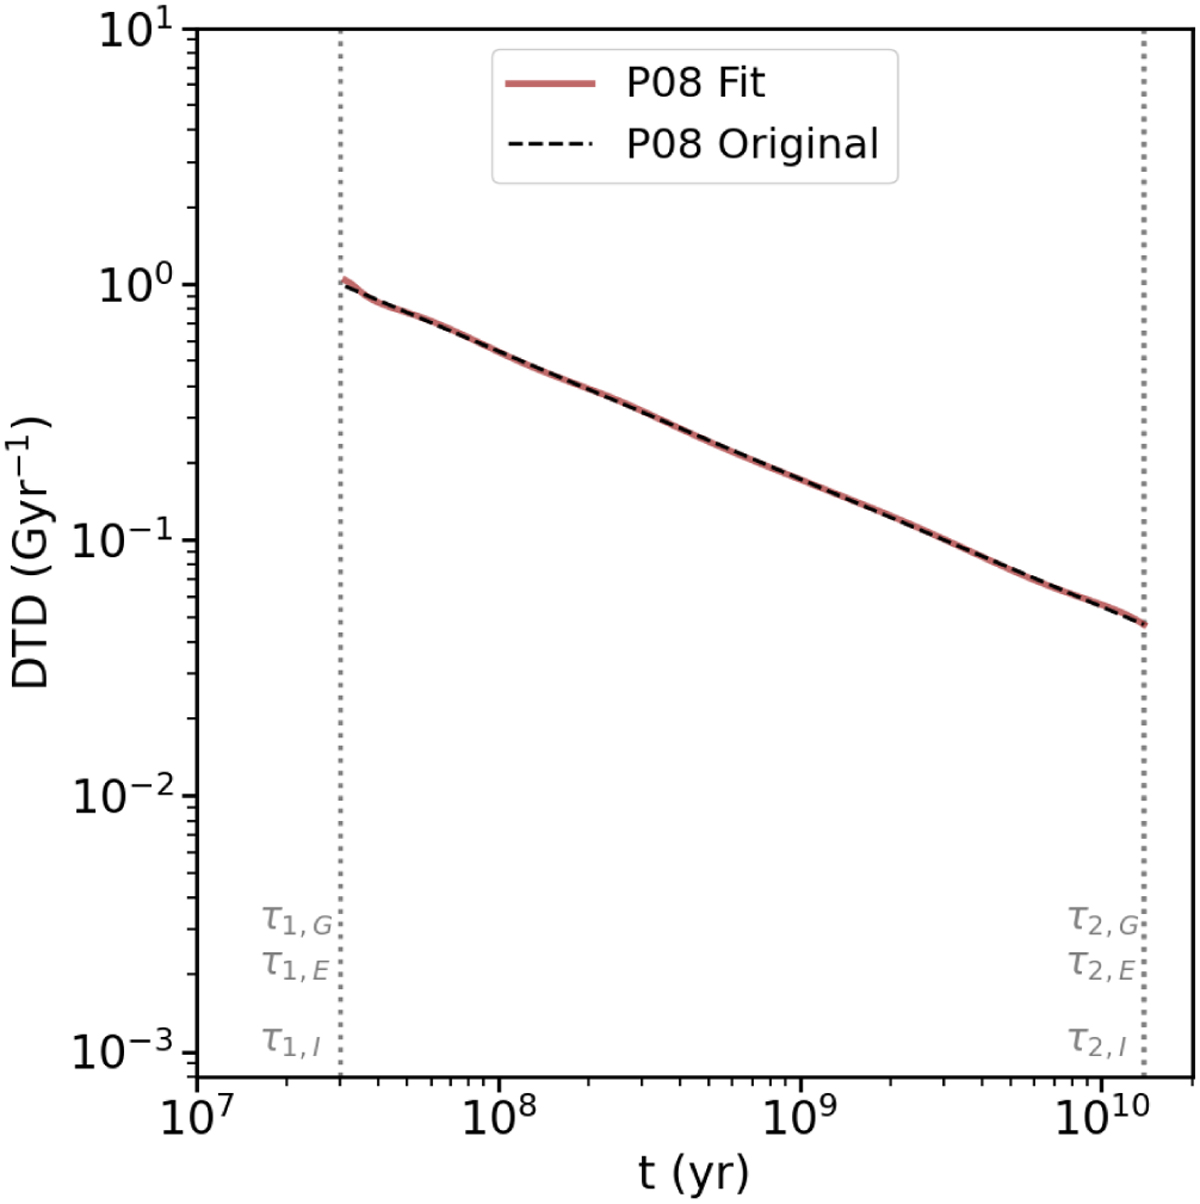
Delay time distribution of Pritchet et al. (2008) normalised to the maximum (dashed black curve) and its fit using one Gaussian curve, four exponentials, and four (t − τ0)−1 functions (solid brown line). Vertical dotted lines indicate the time domain (τ1, τ2)G,Ε,I of the fitting for each section of the DTD (see Table 2 for the adopted parameters).
Current usage metrics show cumulative count of Article Views (full-text article views including HTML views, PDF and ePub downloads, according to the available data) and Abstracts Views on Vision4Press platform.
Data correspond to usage on the plateform after 2015. The current usage metrics is available 48-96 hours after online publication and is updated daily on week days.
Initial download of the metrics may take a while.