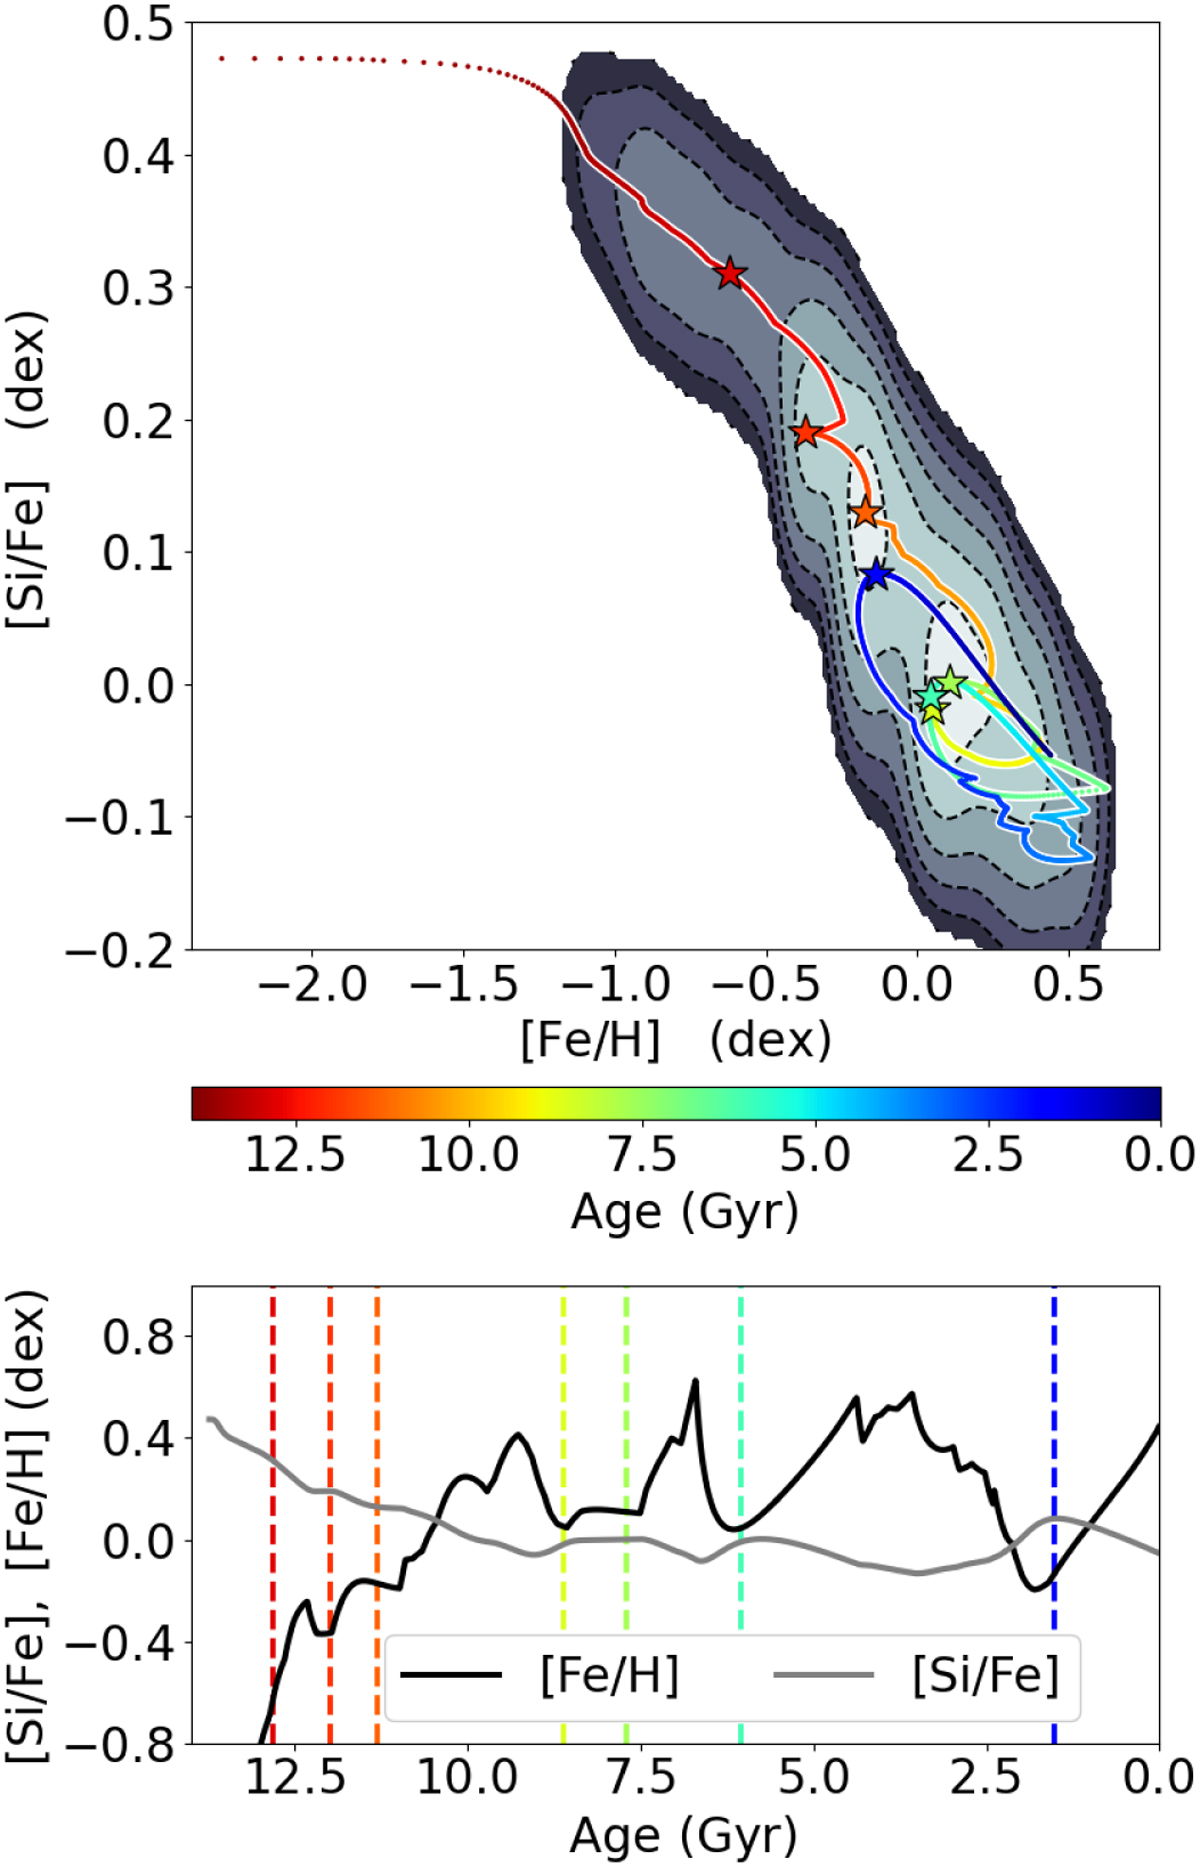
Fig. 12
Download original image
Chemical information extracted from the star formation history shown in Fig. 11. Upper panel: [Si/Fe] versus [Fe/H] diagram. The evolution track is colour-coded with the stellar ages while the star markers indicate the maxima in the SFR (tmax). The evolutionary track is blurred with a 2D Gaussian kernel of width 0.05 dex (greyscale contour plot). Lower panel: age-metallicity (solid black line) and [Si/Fe] versus age (solid grey line) relations predicted by the same model as the upper panel. Dashed vertical lines denote the ages associated with tmax (star markers in the upper panel and dashed vertical lines in Fig. 11) and follow the same colour code convention as the upper panel.
Current usage metrics show cumulative count of Article Views (full-text article views including HTML views, PDF and ePub downloads, according to the available data) and Abstracts Views on Vision4Press platform.
Data correspond to usage on the plateform after 2015. The current usage metrics is available 48-96 hours after online publication and is updated daily on week days.
Initial download of the metrics may take a while.